Pyruvate Kinase
(All numbering and residues are taken from first PDB file)
![]()
![]()
Bending Residue Dihedral Analysis
Residue
iResidue
i+1Distance of hinge axis to residue i in
(A) Distance of hinge axis to residue i in
(A) Change in
(deg) Change in
(deg) Angle of psi(i) axis to hinge axis
(deg) Angle of psi(i) axis to hinge axis
(deg) Percentage Progress
ILE-89
ARG-90
7.7
7.1
-1.0
11.4
60.7
70.5
-65.4
ARG-90
THR-91
9.1
8.7
9.7
-16.6
176.4
160.4
146.3
THR-91
GLY-92
8.7
8.4
5.5
-3.2
124.9
117.6
46.9

Graph shows rotational transition at bending residues and can be used
to identify hinge bending residues.
Probably only informative for interdomain rotations greater than 20 degrees
Residue
iResidue
i+1Distance of hinge axis to residue i in
(A) Distance of hinge axis to residue i in
(A) Change in
(deg) Change in
(deg) Angle of psi(i) axis to hinge axis
(deg) Angle of psi(i) axis to hinge axis
(deg) Percentage Progress
ASP-183
VAL-184
6.6
7.0
16.2
5.9
52.2
56.4
61.9
VAL-184
ASP-185
5.6
5.9
31.4
-29.1
124.6
103.9
-11.1
ASP-185
LEU-186
9.0
9.6
-34.9
24.2
106.6
106.2
-16.0
LEU-186
PRO-187
9.8
10.3
-12.2
5.0
44.0
44.4
10.5
PRO-187
ALA-188
13.1
13.6
-4.1
-2.9
34.4
36.7
21.0

Graph shows rotational transition at bending residues and can be used
to identify hinge bending residues.
Probably only informative for interdomain rotations greater than 20 degrees
Residue
iResidue
i+1Distance of hinge axis to residue i in
(A) Distance of hinge axis to residue i in
(A) Change in
(deg) Change in
(deg) Angle of psi(i) axis to hinge axis
(deg) Angle of psi(i) axis to hinge axis
(deg) Percentage Progress
ASP-264
LEU-265
6.3
6.4
0.7
1.9
87.4
78.0
62.6
LEU-265
GLY-266
4.1
4.1
-3.3
9.1
69.3
79.0
-54.8
GLY-266
VAL-267
7.6
7.4
-24.9
-8.8
8.5
21.4
363.7
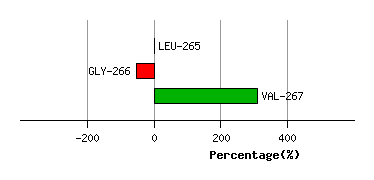
Graph shows rotational transition at bending residues and can be used
to identify hinge bending residues.
Probably only informative for interdomain rotations greater than 20 degrees
Residue
iResidue
i+1Distance of hinge axis to residue i in
(A) Distance of hinge axis to residue i in
(A) Change in
(deg) Change in
(deg) Angle of psi(i) axis to hinge axis
(deg) Angle of psi(i) axis to hinge axis
(deg) Percentage Progress
ALA-277
GLN-278
5.0
4.4
1.5
-4.1
126.5
132.1
38.6
GLN-278
LYS-279
4.1
3.9
-4.7
-0.9
21.2
24.8
56.8
LYS-279
ILE-280
4.7
4.6
2.4
-3.8
93.9
91.6
-49.2

Graph shows rotational transition at bending residues and can be used
to identify hinge bending residues.
Probably only informative for interdomain rotations greater than 20 degrees