Glycine Betaine/carnitine/choline-Binding Protein
(All numbering and residues are taken from first PDB file)
![]()
![]()
Bending Residue Dihedral Analysis
Residue
iResidue
i+1Distance of hinge axis to residue i in
(A) Distance of hinge axis to residue i in
(A) Change in
(deg) Change in
(deg) Angle of psi(i) axis to hinge axis
(deg) Angle of psi(i) axis to hinge axis
(deg) Percentage Progress
TYR-131
GLY-132
13.5
13.2
-18.3
15.0
88.6
88.3
25.7
GLY-132
PHE-133
12.2
11.6
-13.1
23.4
98.8
99.3
6.2
PHE-133
ASP-134
8.5
8.0
12.7
-8.3
123.2
130.1
-21.3
ASP-134
ASN-135
5.2
4.6
-5.9
16.3
133.5
130.7
58.2
ASN-135
THR-136
2.7
2.5
8.3
-14.7
124.8
135.1
27.5
THR-136
TYR-137
1.1
1.0
0.5
0.8
64.7
65.5
11.2

Graph shows rotational transition at bending residues and can be used
to identify hinge bending residues.
Probably only informative for interdomain rotations greater than 20 degrees
Residue
iResidue
i+1Distance of hinge axis to residue i in
(A) Distance of hinge axis to residue i in
(A) Change in
(deg) Change in
(deg) Angle of psi(i) axis to hinge axis
(deg) Angle of psi(i) axis to hinge axis
(deg) Percentage Progress
PHE-238
PRO-239
4.2
3.9
-4.3
2.9
111.4
109.9
1.1
PRO-239
PRO-240
2.0
1.3
4.9
-9.1
143.8
140.7
21.9
PRO-240
TYR-241
2.4
2.5
-0.2
5.1
58.5
58.3
36.7
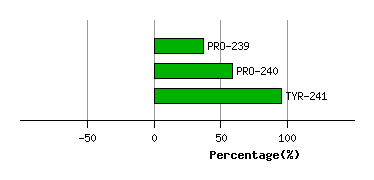
Graph shows rotational transition at bending residues and can be used
to identify hinge bending residues.
Probably only informative for interdomain rotations greater than 20 degrees