Histidyl-Trna Synthetase
(All numbering and residues are taken from first PDB file)
![]()
![]()
Bending Residue Dihedral Analysis
Residue
iResidue
i+1Distance of hinge axis to residue i in
(A) Distance of hinge axis to residue i in
(A) Change in
(deg) Change in
(deg) Angle of psi(i) axis to hinge axis
(deg) Angle of psi(i) axis to hinge axis
(deg) Percentage Progress
GLY-173
GLY-174
18.5
18.6
10.7
-10.1
99.7
77.1
-9.6
THR-176
SER-177
22.2
22.2
-47.4
17.7
154.6
144.8
-214.4
SER-177
SER-178
23.7
23.1
27.6
19.3
92.8
101.5
-55.4
SER-178
ASP-179
23.4
23.7
-48.8
6.1
107.0
125.0
-154.9
ASP-179
PRO-180
20.8
23.4
-144.8
-16.9
57.7
68.5
863.8
PRO-180
PHE-181
17.2
21.5
84.0
29.6
123.5
83.1
199.1
PHE-181
SER-182
16.4
18.5
-2.2
-43.0
25.0
68.9
287.7
SER-182
VAL-183
18.8
16.3
103.4
2.5
130.1
165.2
-888.4
VAL-183
PHE-184
16.4
16.4
47.1
12.3
93.8
105.0
-46.2
PHE-184
SER-185
13.2
13.1
-1.4
-1.3
43.3
46.4
41.7
SER-185
ILE-186
14.9
14.8
13.4
-8.0
155.4
157.5
-37.4
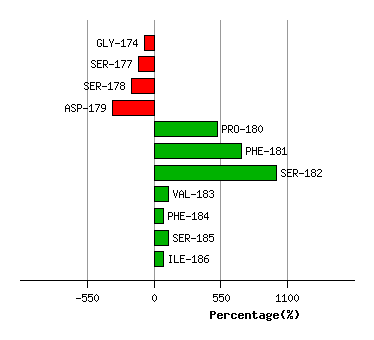
Graph shows rotational transition at bending residues and can be used
to identify hinge bending residues.
Probably only informative for interdomain rotations greater than 20 degrees
Residue
iResidue
i+1Distance of hinge axis to residue i in
(A) Distance of hinge axis to residue i in
(A) Change in
(deg) Change in
(deg) Angle of psi(i) axis to hinge axis
(deg) Angle of psi(i) axis to hinge axis
(deg) Percentage Progress
ASP-217
LEU-218
12.0
12.7
17.1
-16.2
127.1
131.4
-4.3
LEU-218
CYS-219
9.9
10.7
2.4
4.9
73.5
76.6
35.5
CYS-219
SER-220
7.5
8.1
-13.2
20.1
141.7
138.4
38.9

Graph shows rotational transition at bending residues and can be used
to identify hinge bending residues.
Probably only informative for interdomain rotations greater than 20 degrees
Residue
iResidue
i+1Distance of hinge axis to residue i in
(A) Distance of hinge axis to residue i in
(A) Change in
(deg) Change in
(deg) Angle of psi(i) axis to hinge axis
(deg) Angle of psi(i) axis to hinge axis
(deg) Percentage Progress
ASP-260
PHE-261
3.9
4.1
-3.2
0.1
108.8
113.3
20.0
PHE-261
SER-262
6.4
6.3
14.1
-10.8
107.2
111.1
12.0
SER-262
ILE-263
5.6
5.5
2.2
1.1
62.0
66.0
21.5
ILE-263
VAL-264
4.3
3.5
21.8
-1.6
48.4
43.5
109.5
VAL-264
ARG-265
7.9
6.7
-34.9
148.0
101.5
114.5
119.2
ARG-265
GLY-266
9.7
8.4
13.4
-159.3
20.8
88.8
-867.2
GLY-266
LEU-267
10.9
12.2
-48.3
2.4
134.0
152.8
-388.3
LEU-267
SER-268
9.8
13.4
155.2
-11.8
46.3
63.0
611.7

Graph shows rotational transition at bending residues and can be used
to identify hinge bending residues.
Probably only informative for interdomain rotations greater than 20 degrees
Residue
iResidue
i+1Distance of hinge axis to residue i in
(A) Distance of hinge axis to residue i in
(A) Change in
(deg) Change in
(deg) Angle of psi(i) axis to hinge axis
(deg) Angle of psi(i) axis to hinge axis
(deg) Percentage Progress
ILE-273
VAL-274
1.3
1.4
-7.1
4.8
120.2
123.1
-2.7
VAL-274
PHE-275
2.8
3.1
-5.8
1.8
132.0
131.5
-11.3
PHE-275
GLU-276
3.3
3.6
-3.5
-1.6
130.4
129.7
-35.9

Graph shows rotational transition at bending residues and can be used
to identify hinge bending residues.
Probably only informative for interdomain rotations greater than 20 degrees