Glutamate Receptor Subunit 2
(All numbering and residues are taken from first PDB file)
![]()
![]()
Bending Residue Dihedral Analysis
Residue
iResidue
i+1Distance of hinge axis to residue i in
(A) Distance of hinge axis to residue i in
(A) Change in
(deg) Change in
(deg) Angle of psi(i) axis to hinge axis
(deg) Angle of psi(i) axis to hinge axis
(deg) Percentage Progress
GLY-110
ILE-111
3.7
3.7
10.3
-2.0
25.0
26.0
105.8
GLY-110
ILE-111
3.7
3.7
10.3
-2.0
25.0
26.0
105.8
ILE-111
SER-112
2.9
2.6
-9.2
6.8
113.6
112.3
32.7
SER-112
ILE-113
0.3
0.5
-6.9
2.1
153.4
153.2
-85.1
ILE-113
MET-114
1.3
1.4
-1.2
0.4
137.6
138.7
30.9
MET-114
ILE-115
0.9
1.0
1.5
-6.0
39.3
40.2
-39.3

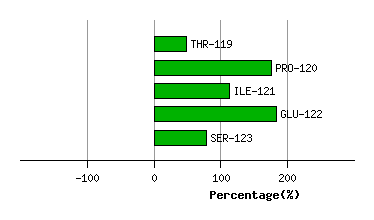
Graph shows rotational transition at bending residues and can be used
to identify hinge bending residues.
Probably only informative for interdomain rotations greater than 20 degrees
Residue
iResidue
i+1Distance of hinge axis to residue i in
(A) Distance of hinge axis to residue i in
(A) Change in
(deg) Change in
(deg) Angle of psi(i) axis to hinge axis
(deg) Angle of psi(i) axis to hinge axis
(deg) Percentage Progress
GLY-118
THR-119
8.9
8.8
-23.4
10.0
74.9
64.9
-50.4
THR-119
PRO-120
7.8
8.0
-3.6
-4.2
46.2
45.2
126.9
PRO-120
ILE-121
11.1
11.2
-1.7
2.5
28.9
26.6
-62.1
ILE-121
GLU-122
9.5
9.4
7.0
-15.2
128.9
123.1
70.7
GLU-122
SER-123
9.8
9.5
7.7
-0.4
148.3
154.3
-105.0
Graph shows rotational transition at bending residues and can be used
to identify hinge bending residues.
Probably only informative for interdomain rotations greater than 20 degrees
Residue
iResidue
i+1Distance of hinge axis to residue i in
(A) Distance of hinge axis to residue i in
(A) Change in
(deg) Change in
(deg) Angle of psi(i) axis to hinge axis
(deg) Angle of psi(i) axis to hinge axis
(deg) Percentage Progress
VAL-178
ALA-179
6.6
6.4
-5.3
6.5
9.4
8.7
15.2
ALA-179
ARG-180
7.3
7.3
3.3
-5.2
101.1
104.0
27.9
ARG-180
VAL-181
6.6
6.5
1.3
-0.3
83.7
87.4
-2.9
VAL-181
ARG-182
3.0
2.9
2.0
-3.4
144.4
146.7
4.1

Graph shows rotational transition at bending residues and can be used
to identify hinge bending residues.
Probably only informative for interdomain rotations greater than 20 degrees
Residue
iResidue
i+1Distance of hinge axis to residue i in
(A) Distance of hinge axis to residue i in
(A) Change in
(deg) Change in
(deg) Angle of psi(i) axis to hinge axis
(deg) Angle of psi(i) axis to hinge axis
(deg) Percentage Progress
SER-184
LYS-185
4.4
4.8
4.4
-1.3
80.6
73.7
48.0
LYS-185
GLY-186
3.8
3.9
4.6
-1.1
137.6
129.4
-34.1
GLY-186
LYS-187
5.1
5.3
1.1
-10.4
108.9
116.6
89.8
LYS-187
TYR-188
7.4
7.5
7.9
0.9
134.4
138.0
-64.9

Graph shows rotational transition at bending residues and can be used
to identify hinge bending residues.
Probably only informative for interdomain rotations greater than 20 degrees
Residue
iResidue
i+1Distance of hinge axis to residue i in
(A) Distance of hinge axis to residue i in
(A) Change in
(deg) Change in
(deg) Angle of psi(i) axis to hinge axis
(deg) Angle of psi(i) axis to hinge axis
(deg) Percentage Progress
TYR-190
LEU-191
4.1
4.2
3.1
0.8
15.9
19.5
32.9
LEU-191
LEU-192
4.5
4.3
-2.2
6.8
103.9
102.1
-0.5
LEU-192
GLU-193
5.3
5.2
9.0
1.0
43.4
42.2
111.7

Graph shows rotational transition at bending residues and can be used
to identify hinge bending residues.
Probably only informative for interdomain rotations greater than 20 degrees
Residue
iResidue
i+1Distance of hinge axis to residue i in
(A) Distance of hinge axis to residue i in
(A) Change in
(deg) Change in
(deg) Angle of psi(i) axis to hinge axis
(deg) Angle of psi(i) axis to hinge axis
(deg) Percentage Progress
ASP-216
SER-217
7.0
6.9
1.5
-1.6
98.3
98.0
9.8
SER-217
LYS-218
3.3
3.2
-4.6
26.3
107.6
102.3
92.1
ASP-216
SER-217
1.4
1.8
1.5
-1.6
98.8
99.0
-12.4
ASP-216
SER-217
7.0
6.9
1.5
-1.6
98.3
98.0
9.8
SER-217
LYS-218
3.3
3.2
-4.6
26.3
107.6
102.3
92.1
GLY-213
ASN-214
5.9
5.8
-11.7
15.5
86.4
84.9
-71.8
ASN-214
LEU-215
2.5
2.3
-1.4
-5.7
61.4
60.7
4.3
LEU-215
ASP-216
2.5
2.5
1.4
2.6
156.3
149.9
-30.4
ASP-216
SER-217
1.4
1.8
1.5
-1.6
98.8
99.0
-12.4

Graph shows rotational transition at bending residues and can be used
to identify hinge bending residues.
Probably only informative for interdomain rotations greater than 20 degrees