Phosphoenolpyruvate Carboxykinase, Cytosolic [Gtp]
(All numbering and residues are taken from first PDB file)
![]()
![]()
Bending Residue Dihedral Analysis
Residue
iResidue
i+1Distance of hinge axis to residue i in
(A) Distance of hinge axis to residue i in
(A) Change in
(deg) Change in
(deg) Angle of psi(i) axis to hinge axis
(deg) Angle of psi(i) axis to hinge axis
(deg) Percentage Progress
PRO-82
ARG-83
23.3
23.3
1.0
6.1
143.4
143.7
-64.5
ARG-83
ASP-84
22.0
22.0
-7.9
2.0
89.2
90.6
66.4
ASP-84
VAL-85
19.0
19.0
-3.3
7.9
157.5
158.8
35.0

Graph shows rotational transition at bending residues and can be used
to identify hinge bending residues.
Probably only informative for interdomain rotations greater than 20 degrees
Residue
iResidue
i+1Distance of hinge axis to residue i in
(A) Distance of hinge axis to residue i in
(A) Change in
(deg) Change in
(deg) Angle of psi(i) axis to hinge axis
(deg) Angle of psi(i) axis to hinge axis
(deg) Percentage Progress
ARG-87
ILE-88
11.2
10.8
-14.6
-1.7
127.4
124.8
183.4
ILE-88
GLU-89
12.5
12.0
0.9
3.1
53.5
45.4
127.3
GLU-89
SER-90
10.2
10.0
3.0
0.3
13.3
21.9
29.8

Graph shows rotational transition at bending residues and can be used
to identify hinge bending residues.
Probably only informative for interdomain rotations greater than 20 degrees
Residue
iResidue
i+1Distance of hinge axis to residue i in
(A) Distance of hinge axis to residue i in
(A) Change in
(deg) Change in
(deg) Angle of psi(i) axis to hinge axis
(deg) Angle of psi(i) axis to hinge axis
(deg) Percentage Progress
VAL-93
ILE-94
5.6
5.7
6.3
-8.0
95.3
94.5
22.8
ILE-94
ILE-95
2.3
2.3
-6.1
3.4
5.2
3.8
39.7
ILE-95
THR-96
2.5
2.6
3.5
0.0
103.8
102.7
101.1

Graph shows rotational transition at bending residues and can be used
to identify hinge bending residues.
Probably only informative for interdomain rotations greater than 20 degrees
Residue
iResidue
i+1Distance of hinge axis to residue i in
(A) Distance of hinge axis to residue i in
(A) Change in
(deg) Change in
(deg) Angle of psi(i) axis to hinge axis
(deg) Angle of psi(i) axis to hinge axis
(deg) Percentage Progress
LEU-113
GLY-114
9.8
9.5
-3.4
12.6
105.6
105.9
153.0
GLY-114
ARG-115
7.0
6.6
-8.7
-1.6
142.5
132.8
-143.0
ARG-115
TRP-116
7.0
6.9
-30.1
23.1
126.7
132.4
-51.8
TRP-116
MET-117
4.9
4.8
-4.6
6.7
129.3
125.9
54.0
MET-117
SER-118
5.3
5.4
-3.0
1.3
129.1
132.4
40.4
SER-118
GLU-119
3.8
4.0
1.8
5.7
93.6
91.3
72.6
GLU-119
GLU-120
5.3
5.1
-7.5
-3.2
124.0
119.6
-81.9
GLU-120
ASP-121
7.2
7.2
5.0
0.5
117.2
119.1
28.0
ASP-121
PHE-122
8.9
9.1
0.9
-1.0
140.4
137.1
3.3
PHE-122
GLU-123
9.1
9.1
0.2
1.2
71.7
70.2
24.1

Graph shows rotational transition at bending residues and can be used
to identify hinge bending residues.
Probably only informative for interdomain rotations greater than 20 degrees
Residue
iResidue
i+1Distance of hinge axis to residue i in
(A) Distance of hinge axis to residue i in
(A) Change in
(deg) Change in
(deg) Angle of psi(i) axis to hinge axis
(deg) Angle of psi(i) axis to hinge axis
(deg) Percentage Progress
ALA-247
LEU-248
6.3
6.5
7.2
-1.3
95.0
94.7
-106.9
LEU-248
ARG-249
3.3
3.4
-2.4
-3.7
7.7
8.1
73.7
ARG-249
ILE-250
2.5
2.7
-2.1
-0.6
56.9
57.4
9.5

Graph shows rotational transition at bending residues and can be used
to identify hinge bending residues.
Probably only informative for interdomain rotations greater than 20 degrees
Residue
iResidue
i+1Distance of hinge axis to residue i in
(A) Distance of hinge axis to residue i in
(A) Change in
(deg) Change in
(deg) Angle of psi(i) axis to hinge axis
(deg) Angle of psi(i) axis to hinge axis
(deg) Percentage Progress
ILE-270
THR-271
11.2
11.4
-1.5
-4.8
54.1
52.6
28.1
THR-271
ASN-272
13.2
13.2
-6.5
12.1
50.1
46.8
-158.3
ASN-272
PRO-273
14.9
14.8
-3.7
9.1
19.4
23.1
-223.0
PRO-273
GLU-274
15.5
14.8
-12.3
9.1
80.0
75.2
77.2
GLU-274
GLY-275
19.0
18.1
-11.6
16.9
113.8
120.6
66.2
GLY-275
LYS-276
18.0
17.0
-15.8
25.5
161.9
157.8
213.7
LYS-276
LYS-277
18.6
18.5
-5.6
-0.1
123.2
131.7
25.1
LYS-277
LYS-278
16.2
16.3
6.9
-4.5
20.4
20.3
37.2
LYS-278
TYR-279
15.9
15.9
8.6
-8.1
61.4
60.4
-35.3
TYR-279
LEU-280
13.5
13.5
2.1
-4.4
52.4
52.5
7.3

Graph shows rotational transition at bending residues and can be used
to identify hinge bending residues.
Probably only informative for interdomain rotations greater than 20 degrees
Residue
iResidue
i+1Distance of hinge axis to residue i in
(A) Distance of hinge axis to residue i in
(A) Change in
(deg) Change in
(deg) Angle of psi(i) axis to hinge axis
(deg) Angle of psi(i) axis to hinge axis
(deg) Percentage Progress
ASN-327
PRO-328
9.2
9.2
-3.6
1.4
118.7
123.6
-63.6
PRO-328
GLU-329
10.1
10.1
4.1
2.7
105.9
103.3
20.4
GLU-329
ASN-330
9.1
9.3
0.6
0.0
147.2
143.9
-10.5

Graph shows rotational transition at bending residues and can be used
to identify hinge bending residues.
Probably only informative for interdomain rotations greater than 20 degrees
Residue
iResidue
i+1Distance of hinge axis to residue i in
(A) Distance of hinge axis to residue i in
(A) Change in
(deg) Change in
(deg) Angle of psi(i) axis to hinge axis
(deg) Angle of psi(i) axis to hinge axis
(deg) Percentage Progress
VAL-335
ALA-336
9.9
9.9
0.0
1.7
157.7
158.6
54.7
ALA-336
PRO-337
12.3
12.3
-4.7
0.7
116.9
114.9
-11.3
PRO-337
GLY-338
14.4
14.4
3.5
-8.0
66.7
72.3
-107.1
GLY-338
THR-339
13.2
13.3
9.2
-4.5
53.4
56.5
92.1
THR-339
SER-340
10.7
10.6
-3.2
4.8
155.8
156.3
32.5
SER-340
VAL-341
11.0
10.9
1.9
-2.8
52.0
53.1
-64.9
VAL-341
LYS-342
8.9
8.9
-1.5
8.0
95.6
91.3
94.2
LYS-342
THR-343
9.3
9.6
2.6
-5.8
141.6
144.6
18.2
THR-343
ASN-344
8.6
8.7
10.5
-18.1
110.5
108.0
117.8
ASN-344
PRO-345
5.6
5.6
2.2
1.1
56.8
52.7
-55.4
PRO-345
ASN-346
5.3
5.4
-2.2
-3.5
70.7
73.9
-29.7
ASN-346
ALA-347
3.9
4.0
6.2
-3.8
136.0
136.4
-56.3
ALA-347
ILE-348
6.1
6.3
4.7
-1.9
63.4
62.1
29.4
ILE-348
LYS-349
8.9
9.0
-0.6
5.3
108.8
111.4
-89.8
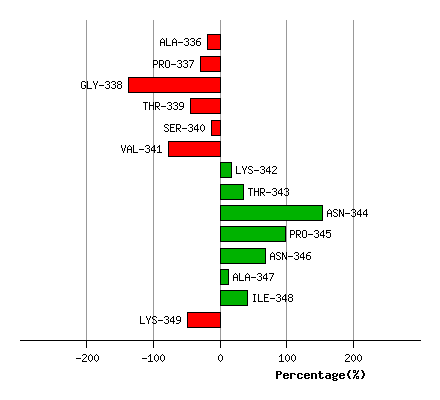
Graph shows rotational transition at bending residues and can be used
to identify hinge bending residues.
Probably only informative for interdomain rotations greater than 20 degrees
Residue
iResidue
i+1Distance of hinge axis to residue i in
(A) Distance of hinge axis to residue i in
(A) Change in
(deg) Change in
(deg) Angle of psi(i) axis to hinge axis
(deg) Angle of psi(i) axis to hinge axis
(deg) Percentage Progress
PRO-418
ALA-419
14.4
14.4
-7.4
-1.0
29.4
28.1
154.4
ALA-419
TRP-420
15.2
15.3
3.5
1.7
140.4
139.0
-117.8
TRP-420
GLU-421
12.6
12.6
4.6
-8.2
136.3
137.0
20.3

Graph shows rotational transition at bending residues and can be used
to identify hinge bending residues.
Probably only informative for interdomain rotations greater than 20 degrees