Glycerol Kinase
(All numbering and residues are taken from first PDB file)
![]()
![]()
Bending Residue Dihedral Analysis
Residue
iResidue
i+1Distance of hinge axis to residue i in
(A) Distance of hinge axis to residue i in
(A) Change in
(deg) Change in
(deg) Angle of psi(i) axis to hinge axis
(deg) Angle of psi(i) axis to hinge axis
(deg) Percentage Progress
LYS-262
ASN-263
4.2
4.0
-5.3
-2.0
62.7
62.2
12.6
ASN-263
THR-264
1.1
0.9
3.3
1.1
52.3
50.7
32.7
THR-264
TYR-265
4.4
4.3
-8.0
9.0
84.6
85.8
17.1

Graph shows rotational transition at bending residues and can be used
to identify hinge bending residues.
Probably only informative for interdomain rotations greater than 20 degrees
Residue
iResidue
i+1Distance of hinge axis to residue i in
(A) Distance of hinge axis to residue i in
(A) Change in
(deg) Change in
(deg) Angle of psi(i) axis to hinge axis
(deg) Angle of psi(i) axis to hinge axis
(deg) Percentage Progress
CYS-269
PHE-270
6.5
6.2
14.3
6.3
50.5
46.1
120.1
PHE-270
MET-271
4.3
4.5
-2.4
-5.2
72.4
74.1
19.6
MET-271
LEU-272
1.4
1.3
9.4
-7.7
53.8
53.1
24.3

Graph shows rotational transition at bending residues and can be used
to identify hinge bending residues.
Probably only informative for interdomain rotations greater than 20 degrees
Residue
iResidue
i+1Distance of hinge axis to residue i in
(A) Distance of hinge axis to residue i in
(A) Change in
(deg) Change in
(deg) Angle of psi(i) axis to hinge axis
(deg) Angle of psi(i) axis to hinge axis
(deg) Percentage Progress
LEU-302
GLU-303
6.2
5.9
6.0
-5.9
54.4
53.4
8.7
GLU-303
GLY-304
3.6
3.3
9.2
-34.2
108.2
111.1
27.3
GLY-304
ALA-305
1.3
1.7
14.3
-0.3
61.7
42.6
72.4
ALA-305
VAL-306
5.1
5.1
17.2
11.5
88.3
97.3
-61.3
VAL-306
PHE-307
7.5
7.7
-11.0
1.7
104.2
102.7
-0.7

Graph shows rotational transition at bending residues and can be used
to identify hinge bending residues.
Probably only informative for interdomain rotations greater than 20 degrees
Residue
iResidue
i+1Distance of hinge axis to residue i in
(A) Distance of hinge axis to residue i in
(A) Change in
(deg) Change in
(deg) Angle of psi(i) axis to hinge axis
(deg) Angle of psi(i) axis to hinge axis
(deg) Percentage Progress
VAL-391
LEU-392
4.7
4.9
-1.7
-3.2
70.5
75.4
7.9
LEU-392
GLU-393
6.2
6.4
8.3
3.7
51.1
52.6
38.1
GLU-393
ALA-394
9.1
9.3
0.4
-4.2
33.5
35.5
-9.3

Graph shows rotational transition at bending residues and can be used
to identify hinge bending residues.
Probably only informative for interdomain rotations greater than 20 degrees
Residue
iResidue
i+1Distance of hinge axis to residue i in
(A) Distance of hinge axis to residue i in
(A) Change in
(deg) Change in
(deg) Angle of psi(i) axis to hinge axis
(deg) Angle of psi(i) axis to hinge axis
(deg) Percentage Progress
GLY-400
ILE-401
13.8
14.2
-6.2
26.4
165.6
164.8
53.8
ILE-401
ARG-402
13.5
13.5
-12.0
5.9
118.2
117.8
-22.8
ARG-402
LEU-403
13.3
13.6
-19.0
23.4
153.5
156.3
31.0

Graph shows rotational transition at bending residues and can be used
to identify hinge bending residues.
Probably only informative for interdomain rotations greater than 20 degrees
Residue
iResidue
i+1Distance of hinge axis to residue i in
(A) Distance of hinge axis to residue i in
(A) Change in
(deg) Change in
(deg) Angle of psi(i) axis to hinge axis
(deg) Angle of psi(i) axis to hinge axis
(deg) Percentage Progress
GLU-431
ARG-432
4.8
5.4
-0.9
-0.4
85.8
81.1
22.7
ARG-432
PRO-433
1.3
2.2
-12.2
10.1
52.3
53.1
17.2
PRO-433
GLU-434
3.6
4.6
-11.8
4.5
47.0
37.0
67.6

Graph shows rotational transition at bending residues and can be used
to identify hinge bending residues.
Probably only informative for interdomain rotations greater than 20 degrees
Residue
iResidue
i+1Distance of hinge axis to residue i in
(A) Distance of hinge axis to residue i in
(A) Change in
(deg) Change in
(deg) Angle of psi(i) axis to hinge axis
(deg) Angle of psi(i) axis to hinge axis
(deg) Percentage Progress
ILE-466
GLU-467
5.4
6.9
17.8
0.9
35.4
39.0
106.7
GLU-467
ARG-468
2.4
3.9
-8.1
13.7
93.4
89.0
26.0
ARG-468
GLU-469
4.0
4.7
-11.6
9.8
28.8
29.9
-5.1
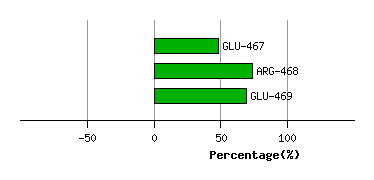
Graph shows rotational transition at bending residues and can be used
to identify hinge bending residues.
Probably only informative for interdomain rotations greater than 20 degrees