A Type Vi-A Crispr-Cas Rna-Guided RNA Ribonuclease, Cas13a
(All numbering and residues are taken from first PDB file)
![]()
![]()
Bending Residue Dihedral Analysis
Residue
iResidue
i+1Distance of hinge axis to residue i in
(A) Distance of hinge axis to residue i in
(A) Change in
(deg) Change in
(deg) Angle of psi(i) axis to hinge axis
(deg) Angle of psi(i) axis to hinge axis
(deg) Percentage Progress
LYS-510
LYS-511
6.1
3.7
-8.4
9.1
114.8
110.3
-2.7
LYS-511
LEU-512
9.0
6.9
-9.8
6.7
53.9
46.1
0.8
LEU-512
LYS-513
10.1
8.4
-17.3
3.0
86.2
75.9
13.0
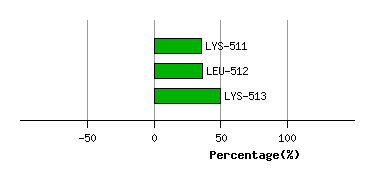
Graph shows rotational transition at bending residues and can be used
to identify hinge bending residues.
Probably only informative for interdomain rotations greater than 20 degrees
Residue
iResidue
i+1Distance of hinge axis to residue i in
(A) Distance of hinge axis to residue i in
(A) Change in
(deg) Change in
(deg) Angle of psi(i) axis to hinge axis
(deg) Angle of psi(i) axis to hinge axis
(deg) Percentage Progress
ASP-722
LYS-723
15.3
14.3
-7.4
5.3
24.1
30.0
-12.7
LYS-723
PHE-724
13.8
12.9
-11.1
7.1
96.6
97.6
11.8
PHE-724
LEU-725
10.4
9.5
-4.2
13.7
104.9
105.4
26.4

Graph shows rotational transition at bending residues and can be used
to identify hinge bending residues.
Probably only informative for interdomain rotations greater than 20 degrees
Residue
iResidue
i+1Distance of hinge axis to residue i in
(A) Distance of hinge axis to residue i in
(A) Change in
(deg) Change in
(deg) Angle of psi(i) axis to hinge axis
(deg) Angle of psi(i) axis to hinge axis
(deg) Percentage Progress
LYS-727
TYR-728
9.8
7.7
-35.5
16.4
53.1
58.5
14.2
TYR-728
GLU-729
9.3
6.0
9.1
-10.4
87.6
96.9
6.1
GLU-729
GLN-730
12.7
9.1
-14.5
8.0
150.6
149.3
-21.6
GLN-730
ASN-731
12.0
9.3
-0.4
54.6
95.1
82.9
21.6
GLN-730
ASN-731
12.0
9.3
-0.4
54.6
95.1
82.9
21.6
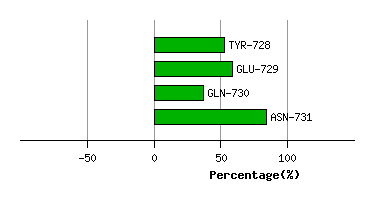
Graph shows rotational transition at bending residues and can be used
to identify hinge bending residues.
Probably only informative for interdomain rotations greater than 20 degrees
Residue
iResidue
i+1Distance of hinge axis to residue i in
(A) Distance of hinge axis to residue i in
(A) Change in
(deg) Change in
(deg) Angle of psi(i) axis to hinge axis
(deg) Angle of psi(i) axis to hinge axis
(deg) Percentage Progress
GLN-730
ASN-731
12.0
9.3
-0.4
54.6
95.1
82.9
21.6
GLN-730
ASN-731
12.0
9.3
-0.4
54.6
95.1
82.9
21.6
ASN-731
ASN-732
9.5
6.2
176.7
155.6
30.7
34.3
-119.1
ASN-732
ASN-733
8.4
6.0
56.9
-37.3
91.1
81.6
30.4
ASN-733
ILE-734
6.0
3.6
-76.7
39.4
35.9
80.7
53.0

Graph shows rotational transition at bending residues and can be used
to identify hinge bending residues.
Probably only informative for interdomain rotations greater than 20 degrees
Residue
iResidue
i+1Distance of hinge axis to residue i in
(A) Distance of hinge axis to residue i in
(A) Change in
(deg) Change in
(deg) Angle of psi(i) axis to hinge axis
(deg) Angle of psi(i) axis to hinge axis
(deg) Percentage Progress
ILE-747
LYS-748
5.9
5.7
14.4
-16.9
60.4
56.7
-20.5
LYS-748
LEU-749
4.6
4.6
-18.0
19.3
99.4
95.9
-11.9
LEU-749
GLY-750
7.0
7.0
-169.6
165.7
153.9
142.9
26.8

Graph shows rotational transition at bending residues and can be used
to identify hinge bending residues.
Probably only informative for interdomain rotations greater than 20 degrees