Nickel-Binding Periplasmic Protein
(All numbering and residues are taken from first PDB file)
![]()
![]()
Bending Residue Dihedral Analysis
Residue
iResidue
i+1Distance of hinge axis to residue i in
(A) Distance of hinge axis to residue i in
(A) Change in
(deg) Change in
(deg) Angle of psi(i) axis to hinge axis
(deg) Angle of psi(i) axis to hinge axis
(deg) Percentage Progress
ALA-125
TYR-126
7.4
7.3
-14.9
28.0
169.3
169.8
58.9
TYR-126
TYR-127
6.6
6.7
5.4
-4.6
72.3
70.4
1.3
TYR-127
PRO-128
4.0
4.3
-3.2
1.5
129.9
131.7
-3.5
PRO-128
PHE-129
2.8
2.8
4.1
-4.3
110.7
110.4
-68.8
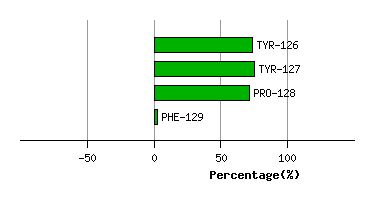
Graph shows rotational transition at bending residues and can be used
to identify hinge bending residues.
Probably only informative for interdomain rotations greater than 20 degrees
Residue
iResidue
i+1Distance of hinge axis to residue i in
(A) Distance of hinge axis to residue i in
(A) Change in
(deg) Change in
(deg) Angle of psi(i) axis to hinge axis
(deg) Angle of psi(i) axis to hinge axis
(deg) Percentage Progress
TYR-218
GLY-219
14.5
14.3
-0.5
-15.4
80.1
82.3
-28.0
GLY-219
ASN-220
11.3
11.3
-11.8
-58.5
106.2
129.1
-227.1
ASN-220
GLU-221
7.6
8.0
174.5
-41.7
7.5
75.5
668.5
GLU-221
GLY-222
6.1
9.1
60.8
177.3
56.5
33.0
-522.0
GLY-222
LEU-223
9.4
10.4
17.8
0.8
84.6
88.9
27.1
LEU-223
LEU-224
11.6
13.2
14.6
18.0
29.3
31.6
106.1
LEU-224
PRO-225
12.1
13.1
-4.7
-6.9
124.7
120.2
-28.5

Graph shows rotational transition at bending residues and can be used
to identify hinge bending residues.
Probably only informative for interdomain rotations greater than 20 degrees
Residue
iResidue
i+1Distance of hinge axis to residue i in
(A) Distance of hinge axis to residue i in
(A) Change in
(deg) Change in
(deg) Angle of psi(i) axis to hinge axis
(deg) Angle of psi(i) axis to hinge axis
(deg) Percentage Progress
ILE-246
GLU-247
3.5
3.4
1.5
12.0
94.6
94.9
-61.8
GLU-247
THR-248
0.8
0.9
12.0
1.4
43.3
39.6
19.1
THR-248
VAL-249
4.0
3.9
-0.7
-2.5
123.6
120.9
62.2
VAL-249
MET-250
5.1
5.1
-4.3
6.6
103.8
107.9
31.9

Graph shows rotational transition at bending residues and can be used
to identify hinge bending residues.
Probably only informative for interdomain rotations greater than 20 degrees
Residue
iResidue
i+1Distance of hinge axis to residue i in
(A) Distance of hinge axis to residue i in
(A) Change in
(deg) Change in
(deg) Angle of psi(i) axis to hinge axis
(deg) Angle of psi(i) axis to hinge axis
(deg) Percentage Progress
SER-468
TYR-469
5.5
5.3
2.5
-4.8
28.7
28.4
-8.4
TYR-469
ILE-470
4.1
4.0
2.3
-37.9
109.2
112.9
107.9
ILE-470
SER-471
2.2
2.1
11.7
7.2
62.5
48.7
14.1
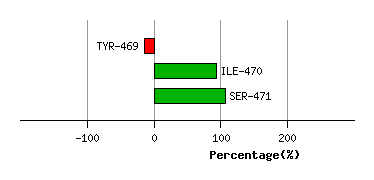
Graph shows rotational transition at bending residues and can be used
to identify hinge bending residues.
Probably only informative for interdomain rotations greater than 20 degrees