Cell Division Protein Ftsz
(All numbering and residues are taken from first PDB file)
![]()
![]()
Bending Residue Dihedral Analysis
Residue
iResidue
i+1Distance of hinge axis to residue i in
(A) Distance of hinge axis to residue i in
(A) Change in
(deg) Change in
(deg) Angle of psi(i) axis to hinge axis
(deg) Angle of psi(i) axis to hinge axis
(deg) Percentage Progress
ILE-197
SER-198
14.3
12.5
-14.3
-3.1
78.0
70.4
33.1
SER-198
ASP-199
18.1
16.0
11.1
3.2
67.7
64.7
39.8
ASP-199
LEU-200
18.1
17.2
2.4
-7.9
120.4
107.6
-8.9
LEU-200
ILE-201
16.0
15.2
15.6
-38.6
144.6
159.2
68.0
ILE-201
ALA-202
18.0
16.2
10.2
21.2
79.2
101.7
-38.9
ALA-202
VAL-203
21.4
19.7
-29.1
2.0
110.7
91.1
-77.4
VAL-203
SER-204
21.4
21.2
1.0
46.6
116.9
86.0
-53.5
SER-204
GLY-205
21.6
19.9
-160.4
177.9
141.1
148.6
73.0
GLY-205
GLU-206
19.8
19.7
3.2
-7.4
96.3
82.3
-14.5
GLU-206
VAL-207
21.3
20.7
-10.1
41.0
61.9
70.3
-74.4
VAL-207
ASN-208
18.2
17.5
7.9
17.6
113.1
153.5
-6.7
ASN-208
LEU-209
17.3
17.7
4.4
-44.5
114.8
108.2
68.1
LEU-209
ASP-210
14.1
14.6
-45.7
43.7
63.7
38.2
-35.2
ASP-210
PHE-211
14.7
14.4
-12.7
-0.2
64.1
75.7
21.5
PHE-211
ALA-212
13.5
12.3
-10.0
7.8
54.5
79.0
24.0
ALA-212
ASP-213
11.5
9.9
-7.6
13.8
124.0
146.8
23.8

Graph shows rotational transition at bending residues and can be used
to identify hinge bending residues.
Probably only informative for interdomain rotations greater than 20 degrees
Residue
iResidue
i+1Distance of hinge axis to residue i in
(A) Distance of hinge axis to residue i in
(A) Change in
(deg) Change in
(deg) Angle of psi(i) axis to hinge axis
(deg) Angle of psi(i) axis to hinge axis
(deg) Percentage Progress
GLY-222
SER-223
8.9
11.2
-90.1
6.5
156.4
113.1
-256.3
SER-223
ALA-224
9.2
11.6
-25.9
73.2
108.5
117.7
74.2
ALA-224
LEU-225
7.1
8.6
-9.6
1.0
165.7
154.6
13.3
LEU-225
MET-226
6.6
8.8
20.3
1.3
92.1
65.1
12.8
MET-226
GLY-227
7.9
8.5
20.2
25.6
15.8
8.5
156.8
GLY-227
ILE-228
8.0
7.4
-12.7
5.2
106.2
105.2
13.8

Graph shows rotational transition at bending residues and can be used
to identify hinge bending residues.
Probably only informative for interdomain rotations greater than 20 degrees
Residue
iResidue
i+1Distance of hinge axis to residue i in
(A) Distance of hinge axis to residue i in
(A) Change in
(deg) Change in
(deg) Angle of psi(i) axis to hinge axis
(deg) Angle of psi(i) axis to hinge axis
(deg) Percentage Progress
LYS-243
ALA-244
5.5
4.8
0.9
-8.8
15.0
19.1
-28.5
ALA-244
ILE-245
5.8
5.2
-14.4
35.4
115.2
114.2
37.2
ILE-245
SER-246
3.4
2.2
-13.5
-40.0
58.5
61.2
110.8
SER-246
SER-247
5.7
4.8
-129.3
73.1
122.5
94.2
-62.7
SER-247
PRO-248
8.7
7.9
86.5
14.8
112.4
77.0
2.7
PRO-248
LEU-249
11.7
11.2
-2.8
28.1
125.6
164.2
87.0
LEU-249
LEU-250
14.1
11.7
-14.0
3.2
156.1
130.0
-32.5
LEU-250
GLU-251
12.4
8.9
-51.9
-6.1
101.7
82.3
48.6
GLU-251
THR-252
13.8
11.7
37.5
-30.0
76.4
70.9
5.9
THR-252
SER-253
10.5
10.0
22.3
37.9
130.0
108.3
-105.6
SER-253
ILE-254
8.0
7.7
-41.4
-0.8
118.9
137.4
-125.8
ILE-254
VAL-255
4.6
4.4
-0.8
-1.3
103.9
113.9
25.1
VAL-255
GLY-256
7.6
6.7
-136.7
177.5
162.0
146.1
156.3
GLY-256
ALA-257
8.4
8.2
-5.2
-24.7
130.9
144.0
-96.6
ALA-257
GLN-258
4.9
5.1
0.4
46.0
69.0
55.4
51.1
GLN-258
GLY-259
5.5
4.5
-15.9
0.7
110.6
86.6
-11.4
GLY-259
VAL-260
2.9
0.9
1.7
0.9
132.7
150.2
4.5
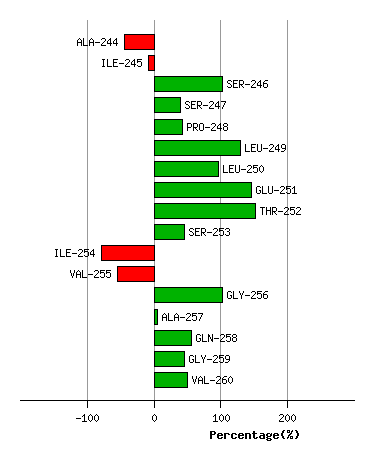
Graph shows rotational transition at bending residues and can be used
to identify hinge bending residues.
Probably only informative for interdomain rotations greater than 20 degrees
Residue
iResidue
i+1Distance of hinge axis to residue i in
(A) Distance of hinge axis to residue i in
(A) Change in
(deg) Change in
(deg) Angle of psi(i) axis to hinge axis
(deg) Angle of psi(i) axis to hinge axis
(deg) Percentage Progress
ASN-291
MET-292
7.5
5.5
-6.2
-12.2
74.3
55.2
49.9
MET-292
ILE-293
7.5
5.9
-15.7
-12.0
125.2
107.7
-18.9
ILE-293
PHE-294
8.7
8.0
32.7
-49.4
143.1
141.0
76.8
PHE-294
GLY-295
11.1
10.0
29.2
-15.1
85.2
95.0
-70.3
GLY-295
THR-296
13.5
13.2
21.7
-11.1
156.5
153.9
-49.4
THR-296
VAL-297
16.1
15.5
-3.9
-13.6
97.7
99.7
5.6
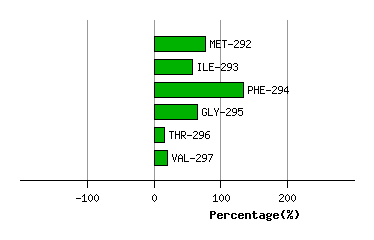
Graph shows rotational transition at bending residues and can be used
to identify hinge bending residues.
Probably only informative for interdomain rotations greater than 20 degrees
Residue
iResidue
i+1Distance of hinge axis to residue i in
(A) Distance of hinge axis to residue i in
(A) Change in
(deg) Change in
(deg) Angle of psi(i) axis to hinge axis
(deg) Angle of psi(i) axis to hinge axis
(deg) Percentage Progress
VAL-310
ILE-311
5.8
5.6
-3.0
10.7
132.8
129.4
38.7
ILE-311
ALA-312
5.1
5.8
7.2
1.5
75.6
69.8
19.9
ALA-312
THR-313
2.1
3.8
-3.7
6.6
133.9
144.4
22.0
THR-313
GLY-314
2.9
4.4
-33.3
2.0
101.6
107.5
-38.4
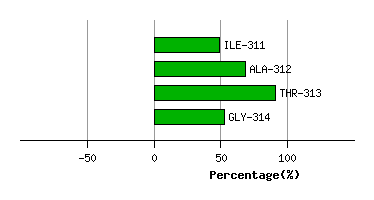
Graph shows rotational transition at bending residues and can be used
to identify hinge bending residues.
Probably only informative for interdomain rotations greater than 20 degrees