Argininosuccinate Synthetase
(All numbering and residues are taken from first PDB file)
![]()
![]()
Bending Residue Dihedral Analysis
Residue
iResidue
i+1Distance of hinge axis to residue i in
(A) Distance of hinge axis to residue i in
(A) Change in
(deg) Change in
(deg) Angle of psi(i) axis to hinge axis
(deg) Angle of psi(i) axis to hinge axis
(deg) Percentage Progress
ALA-26
GLU-27
22.3
22.1
-5.4
28.1
164.4
158.8
661.2
GLU-27
VAL-28
20.8
20.6
0.4
-14.0
90.7
92.4
-163.1
VAL-28
ILE-29
17.5
17.5
-22.5
16.1
137.2
138.4
-197.6
ILE-29
ALA-30
14.7
14.7
-0.9
0.7
96.5
95.5
-130.0
ALA-30
PHE-31
12.6
12.6
10.1
-12.8
74.6
73.0
-31.2
PHE-31
THR-32
8.8
8.8
0.6
5.2
70.9
74.8
114.2
THR-32
ALA-33
7.3
7.3
-4.7
16.5
105.8
103.8
101.4
ALA-33
ASP-34
3.8
3.8
-5.5
6.5
119.3
126.3
-4.6
ASP-34
ILE-35
3.8
3.6
-6.3
1.1
67.3
66.4
-9.1
ILE-35
GLY-36
5.4
5.4
0.8
-4.0
65.4
63.6
-103.0
GLY-36
GLN-37
8.2
8.1
-2.1
3.9
85.6
88.4
-41.7
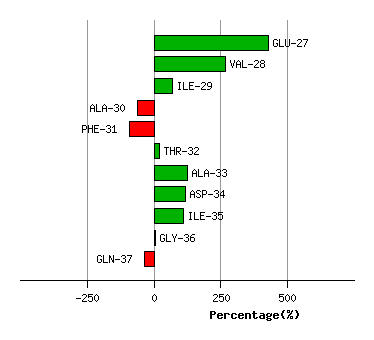
Graph shows rotational transition at bending residues and can be used
to identify hinge bending residues.
Probably only informative for interdomain rotations greater than 20 degrees
Residue
iResidue
i+1Distance of hinge axis to residue i in
(A) Distance of hinge axis to residue i in
(A) Change in
(deg) Change in
(deg) Angle of psi(i) axis to hinge axis
(deg) Angle of psi(i) axis to hinge axis
(deg) Percentage Progress
ALA-58
LEU-59
6.7
6.6
-10.8
13.2
100.0
99.4
-31.5
LEU-59
ASP-60
3.6
3.5
-1.2
-0.7
101.9
104.0
-25.5
ASP-60
LEU-61
0.9
0.9
-4.7
-0.8
44.3
45.8
103.0
LEU-61
LYS-62
2.5
2.6
6.3
-3.2
87.5
86.0
-13.1
LYS-62
GLU-63
5.6
5.6
-4.4
4.7
74.8
74.4
-30.4

Graph shows rotational transition at bending residues and can be used
to identify hinge bending residues.
Probably only informative for interdomain rotations greater than 20 degrees
Residue
iResidue
i+1Distance of hinge axis to residue i in
(A) Distance of hinge axis to residue i in
(A) Change in
(deg) Change in
(deg) Angle of psi(i) axis to hinge axis
(deg) Angle of psi(i) axis to hinge axis
(deg) Percentage Progress
ALA-96
LYS-97
2.5
2.4
-4.6
3.1
88.6
88.6
-8.5
LYS-97
HIS-98
2.6
2.5
-4.7
3.8
51.6
52.5
5.0
HIS-98
LEU-99
4.3
4.1
1.1
1.7
72.2
72.8
42.5
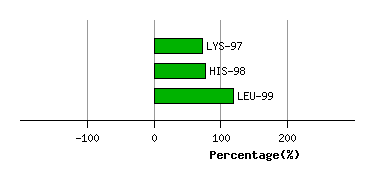
Graph shows rotational transition at bending residues and can be used
to identify hinge bending residues.
Probably only informative for interdomain rotations greater than 20 degrees
Residue
iResidue
i+1Distance of hinge axis to residue i in
(A) Distance of hinge axis to residue i in
(A) Change in
(deg) Change in
(deg) Angle of psi(i) axis to hinge axis
(deg) Angle of psi(i) axis to hinge axis
(deg) Percentage Progress
GLU-126
LEU-127
5.2
5.2
-6.8
2.4
60.0
59.8
64.1
LEU-127
THR-128
2.9
3.0
2.2
-2.3
61.0
58.0
-22.8
THR-128
ALA-129
0.8
0.8
1.2
-2.7
87.7
87.2
35.0

Graph shows rotational transition at bending residues and can be used
to identify hinge bending residues.
Probably only informative for interdomain rotations greater than 20 degrees
Residue
iResidue
i+1Distance of hinge axis to residue i in
(A) Distance of hinge axis to residue i in
(A) Change in
(deg) Change in
(deg) Angle of psi(i) axis to hinge axis
(deg) Angle of psi(i) axis to hinge axis
(deg) Percentage Progress
ALA-131
LEU-132
3.1
3.0
-0.1
3.2
57.5
56.6
-30.1
LEU-132
LYS-133
5.5
5.3
0.5
-3.9
78.9
77.6
-28.2
LYS-133
PRO-134
7.6
7.4
0.1
2.1
36.3
38.4
33.7

Graph shows rotational transition at bending residues and can be used
to identify hinge bending residues.
Probably only informative for interdomain rotations greater than 20 degrees
Residue
iResidue
i+1Distance of hinge axis to residue i in
(A) Distance of hinge axis to residue i in
(A) Change in
(deg) Change in
(deg) Angle of psi(i) axis to hinge axis
(deg) Angle of psi(i) axis to hinge axis
(deg) Percentage Progress
PRO-171
TYR-172
28.4
28.3
-52.3
-8.3
49.0
53.6
935.7
TYR-172
SER-173
25.2
25.2
-8.7
2.0
102.9
108.2
-87.0
SER-173
MET-174
21.5
21.5
13.1
-14.8
82.0
82.5
5.2
MET-174
ASP-175
18.8
18.6
-10.7
16.7
80.1
86.9
55.3

Graph shows rotational transition at bending residues and can be used
to identify hinge bending residues.
Probably only informative for interdomain rotations greater than 20 degrees