Vitamin D Hydroxylase
(All numbering and residues are taken from first PDB file)
![]()
![]()
Bending Residue Dihedral Analysis
Residue
iResidue
i+1Distance of hinge axis to residue i in
(A) Distance of hinge axis to residue i in
(A) Change in
(deg) Change in
(deg) Angle of psi(i) axis to hinge axis
(deg) Angle of psi(i) axis to hinge axis
(deg) Percentage Progress
PRO-146
VAL-147
6.2
6.8
-0.5
-6.5
129.7
132.5
3.8
VAL-147
GLN-148
9.2
9.2
9.6
0.7
101.1
109.7
-2.5
GLN-148
VAL-149
9.9
9.8
0.8
-2.9
75.0
86.2
-9.8
VAL-149
ILE-150
6.6
6.4
3.7
7.0
8.1
18.1
48.5
ILE-150
CYS-151
6.4
6.4
-3.6
5.7
111.8
101.0
7.2
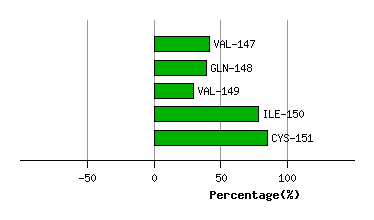
Graph shows rotational transition at bending residues and can be used
to identify hinge bending residues.
Probably only informative for interdomain rotations greater than 20 degrees
Residue
iResidue
i+1Distance of hinge axis to residue i in
(A) Distance of hinge axis to residue i in
(A) Change in
(deg) Change in
(deg) Angle of psi(i) axis to hinge axis
(deg) Angle of psi(i) axis to hinge axis
(deg) Percentage Progress
LEU-211
ALA-212
12.9
13.8
11.8
-8.6
111.2
99.7
16.8
ALA-212
VAL-213
15.7
16.2
7.5
14.1
120.2
119.2
-32.0
VAL-213
SER-214
13.8
14.1
174.5
-101.1
158.7
160.1
-469.6
SER-214
ASP-215
12.0
16.2
147.3
-9.9
129.1
88.3
1137.7
ASP-215
MET-216
15.5
17.2
-148.1
12.9
68.1
55.5
-459.6
MET-216
ASP-217
17.0
20.7
3.3
77.1
130.0
166.2
-424.9
ASP-217
GLY-218
14.5
19.3
-73.4
157.2
81.0
90.1
-57.0
GLY-218
ASP-219
11.4
18.2
7.9
29.9
109.7
83.8
-7.2
ASP-219
ARG-220
10.2
14.5
178.4
-91.6
34.5
36.0
547.4
ARG-220
LEU-221
10.4
12.5
-149.8
71.6
112.1
80.0
-67.2
LEU-221
SER-222
8.1
9.3
18.8
14.4
123.3
121.4
-63.9
SER-222
GLN-223
7.5
9.4
0.7
4.2
55.8
53.9
27.4
GLN-223
GLU-224
9.1
10.6
-0.4
1.4
104.6
97.2
9.3
GLU-224
GLU-225
6.7
7.7
-2.5
-0.6
132.1
129.4
-33.3
GLU-225
LEU-226
3.9
5.3
1.5
-3.3
156.1
162.9
-13.7
GLU-225
LEU-226
3.9
5.3
1.5
-3.3
156.1
162.9
-13.7

Graph shows rotational transition at bending residues and can be used
to identify hinge bending residues.
Probably only informative for interdomain rotations greater than 20 degrees
Residue
iResidue
i+1Distance of hinge axis to residue i in
(A) Distance of hinge axis to residue i in
(A) Change in
(deg) Change in
(deg) Angle of psi(i) axis to hinge axis
(deg) Angle of psi(i) axis to hinge axis
(deg) Percentage Progress
GLU-225
LEU-226
3.9
5.3
1.5
-3.3
156.1
162.9
-13.7
GLU-225
LEU-226
3.9
5.3
1.5
-3.3
156.1
162.9
-13.7
LEU-226
VAL-227
6.6
7.5
-0.5
-3.4
64.4
65.0
25.2
VAL-227
ALA-228
7.7
8.0
0.4
5.0
108.3
95.8
-3.8
ALA-228
MET-229
4.9
4.9
-3.5
-2.5
32.9
35.6
18.4
MET-229
ALA-230
3.1
3.1
3.5
-4.7
143.0
148.2
-5.8
ALA-230
MET-231
6.2
5.8
-1.3
0.8
76.0
80.1
-13.1
MET-231
LEU-232
7.1
6.6
5.1
-0.1
120.2
106.1
-0.8
LEU-232
LEU-233
4.6
3.8
3.4
3.5
163.4
168.4
-50.5
LEU-233
LEU-234
3.4
2.7
-4.9
4.4
54.8
55.0
-0.6
LEU-234
ILE-235
7.0
6.3
-2.6
-6.2
74.4
89.8
27.8
ILE-235
ALA-236
8.3
7.7
2.1
-12.9
132.3
116.1
47.7
ALA-236
GLY-237
5.9
5.9
14.2
-35.3
154.8
173.0
97.4
GLY-237
HIS-238
5.8
4.8
7.5
14.5
114.2
128.9
-44.6
HIS-238
GLU-239
9.5
8.0
-49.9
64.6
102.3
111.2
46.5
HIS-238
GLU-239
9.5
8.0
-49.9
64.6
102.3
111.2
46.5

Graph shows rotational transition at bending residues and can be used
to identify hinge bending residues.
Probably only informative for interdomain rotations greater than 20 degrees
Residue
iResidue
i+1Distance of hinge axis to residue i in
(A) Distance of hinge axis to residue i in
(A) Change in
(deg) Change in
(deg) Angle of psi(i) axis to hinge axis
(deg) Angle of psi(i) axis to hinge axis
(deg) Percentage Progress
HIS-238
GLU-239
9.5
8.0
-49.9
64.6
102.3
111.2
46.5
HIS-238
GLU-239
9.5
8.0
-49.9
64.6
102.3
111.2
46.5
GLU-239
THR-240
10.7
11.0
-49.4
64.8
109.0
115.1
64.4
THR-240
THR-241
9.2
9.7
19.7
-10.3
7.8
17.0
21.9
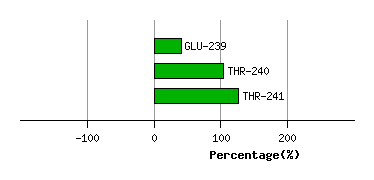
Graph shows rotational transition at bending residues and can be used
to identify hinge bending residues.
Probably only informative for interdomain rotations greater than 20 degrees