D-Glyceraldehyde-3-Phosphate Dehydrogenase 4 (E.C.1.2.1.12)
(All numbering and residues are taken from first PDB file)
![]()
![]()
Bending Residue Dihedral Analysis
Residue
iResidue
i+1Distance of hinge axis to residue i in
(A) Distance of hinge axis to residue i in
(A) Change in
(deg) Change in
(deg) Angle of psi(i) axis to hinge axis
(deg) Angle of psi(i) axis to hinge axis
(deg) Percentage Progress
VAL-30
ASN-31
12.2
12.3
-0.3
-4.9
90.2
92.0
-51.7
ASN-31
ASP-32
15.6
15.6
18.0
2.8
77.0
69.2
166.6
ASP-32
LEU-33
17.0
17.0
50.5
-26.9
119.8
101.8
-163.6
LEU-33
THR-34
20.5
20.6
32.8
-65.5
128.1
150.5
361.1
THR-34
ASP-36
19.4
20.2
51.7
-39.5
158.8
142.0
-148.8
ASP-36
ALA-37
19.3
19.0
12.7
4.4
100.1
96.1
-42.2
ALA-37
ASN-38
15.9
15.5
-17.4
8.4
68.8
68.8
58.4

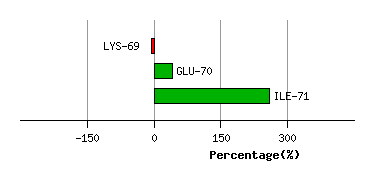
Graph shows rotational transition at bending residues and can be used
to identify hinge bending residues.
Probably only informative for interdomain rotations greater than 20 degrees
Residue
iResidue
i+1Distance of hinge axis to residue i in
(A) Distance of hinge axis to residue i in
(A) Change in
(deg) Change in
(deg) Angle of psi(i) axis to hinge axis
(deg) Angle of psi(i) axis to hinge axis
(deg) Percentage Progress
GLY-68
LYS-69
4.0
4.0
23.8
-15.7
121.5
126.5
-28.2
LYS-69
GLU-70
6.4
6.5
18.9
-4.0
100.7
100.0
48.1
GLU-70
ILE-71
9.1
9.1
22.4
-32.5
160.2
166.8
218.6
Graph shows rotational transition at bending residues and can be used
to identify hinge bending residues.
Probably only informative for interdomain rotations greater than 20 degrees
Residue
iResidue
i+1Distance of hinge axis to residue i in
(A) Distance of hinge axis to residue i in
(A) Change in
(deg) Change in
(deg) Angle of psi(i) axis to hinge axis
(deg) Angle of psi(i) axis to hinge axis
(deg) Percentage Progress
VAL-116
ILE-117
13.0
13.0
-1.8
-2.3
125.3
124.6
-14.0
ILE-117
ILE-118
9.4
9.4
-6.2
11.9
90.8
89.1
-33.3
ILE-118
SER-119
9.9
10.1
15.0
-1.8
86.8
88.4
62.9
SER-119
ALA-120
7.5
8.1
-12.6
-0.6
121.8
131.6
-156.6
ALA-120
PRO-121
9.1
9.2
7.0
-0.5
29.3
33.5
143.7

Graph shows rotational transition at bending residues and can be used
to identify hinge bending residues.
Probably only informative for interdomain rotations greater than 20 degrees
Residue
iResidue
i+1Distance of hinge axis to residue i in
(A) Distance of hinge axis to residue i in
(A) Change in
(deg) Change in
(deg) Angle of psi(i) axis to hinge axis
(deg) Angle of psi(i) axis to hinge axis
(deg) Percentage Progress
ASN-146
ALA-147
4.3
4.6
6.3
-2.6
56.6
56.8
60.6
ALA-147
SER-148
5.0
5.3
-4.5
11.7
54.6
57.7
-68.4
SER-148
CYS-149
6.6
7.1
1.1
-3.7
100.8
106.5
18.7

Graph shows rotational transition at bending residues and can be used
to identify hinge bending residues.
Probably only informative for interdomain rotations greater than 20 degrees
Residue
iResidue
i+1Distance of hinge axis to residue i in
(A) Distance of hinge axis to residue i in
(A) Change in
(deg) Change in
(deg) Angle of psi(i) axis to hinge axis
(deg) Angle of psi(i) axis to hinge axis
(deg) Percentage Progress
VAL-214
ALA-215
2.6
2.8
-3.3
2.4
52.0
54.3
120.2
ALA-215
LEU-216
2.0
2.2
0.5
-8.4
59.6
65.7
-119.1
LEU-216
VAL-217
4.3
4.3
6.0
-10.8
70.5
66.9
123.1
VAL-217
LEU-218
2.7
2.9
21.8
-14.4
134.3
130.0
-103.6
LEU-218
PRO-219
3.0
2.8
-4.8
4.7
34.1
30.2
-145.1

Graph shows rotational transition at bending residues and can be used
to identify hinge bending residues.
Probably only informative for interdomain rotations greater than 20 degrees
Residue
iResidue
i+1Distance of hinge axis to residue i in
(A) Distance of hinge axis to residue i in
(A) Change in
(deg) Change in
(deg) Angle of psi(i) axis to hinge axis
(deg) Angle of psi(i) axis to hinge axis
(deg) Percentage Progress
HIS-319
ARG-320
3.0
2.9
0.5
-3.4
135.4
135.5
124.3
ARG-320
VAL-321
1.9
1.6
5.4
-0.6
78.6
78.4
-8.7
VAL-321
VAL-322
2.2
2.2
-5.5
2.7
130.7
129.0
-91.7

Graph shows rotational transition at bending residues and can be used
to identify hinge bending residues.
Probably only informative for interdomain rotations greater than 20 degrees