Putative Enzyme Ydif
(All numbering and residues are taken from first PDB file)
![]()
![]()
Bending Residue Dihedral Analysis
Residue
iResidue
i+1Distance of hinge axis to residue i in
(A) Distance of hinge axis to residue i in
(A) Change in
(deg) Change in
(deg) Angle of psi(i) axis to hinge axis
(deg) Angle of psi(i) axis to hinge axis
(deg) Percentage Progress
LEU-275
ASP-276
21.0
21.1
-2.2
21.9
56.3
60.5
-339.1
PRO-284
LEU-285
27.0
26.7
-13.2
-4.9
132.3
129.7
-415.2

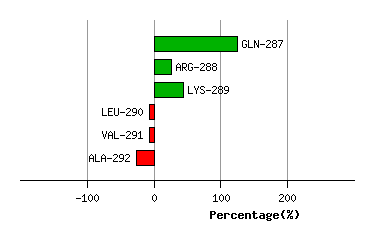
Graph shows rotational transition at bending residues and can be used
to identify hinge bending residues.
Probably only informative for interdomain rotations greater than 20 degrees
Residue
iResidue
i+1Distance of hinge axis to residue i in
(A) Distance of hinge axis to residue i in
(A) Change in
(deg) Change in
(deg) Angle of psi(i) axis to hinge axis
(deg) Angle of psi(i) axis to hinge axis
(deg) Percentage Progress
ASN-286
GLN-287
26.0
25.9
3.8
-15.3
124.9
121.9
170.1
GLN-287
ARG-288
23.9
23.7
12.9
-5.7
74.2
80.0
-99.3
ARG-288
LYS-289
21.4
21.3
4.0
-0.2
39.4
33.1
18.3
LYS-289
LEU-290
20.9
20.8
0.2
1.7
101.5
99.0
-50.9
LEU-290
VAL-291
20.8
20.7
-1.9
-0.3
66.6
67.2
-0.2
VAL-291
ALA-292
17.8
17.7
6.4
-6.6
49.6
49.4
-19.2
Graph shows rotational transition at bending residues and can be used
to identify hinge bending residues.
Probably only informative for interdomain rotations greater than 20 degrees
Residue
iResidue
i+1Distance of hinge axis to residue i in
(A) Distance of hinge axis to residue i in
(A) Change in
(deg) Change in
(deg) Angle of psi(i) axis to hinge axis
(deg) Angle of psi(i) axis to hinge axis
(deg) Percentage Progress
GLY-308
VAL-309
12.9
12.7
-7.5
-47.5
95.1
80.7
-11.1
VAL-309
GLY-310
16.6
16.0
-21.6
-25.4
57.6
57.3
754.8
GLY-310
ILE-311
17.5
17.9
15.0
2.9
53.0
56.7
359.7
ILE-311
ALA-312
18.2
17.8
11.8
15.8
31.2
45.8
706.5
ALA-312
ASP-313
15.5
14.6
-18.2
4.4
133.3
147.2
-273.1
ASP-313
GLY-314
15.9
16.2
-19.4
11.5
156.0
149.2
-273.3
GLY-314
ILE-315
17.4
17.3
-6.6
-6.8
122.0
124.1
-279.0
ILE-315
GLY-316
14.1
13.9
-9.9
3.6
156.8
160.4
-163.8
GLY-316
LEU-317
13.7
13.6
-0.3
0.6
47.0
49.8
5.9
GLY-316
LEU-317
13.7
13.6
-0.3
0.6
47.0
49.8
5.9

Graph shows rotational transition at bending residues and can be used
to identify hinge bending residues.
Probably only informative for interdomain rotations greater than 20 degrees
Residue
iResidue
i+1Distance of hinge axis to residue i in
(A) Distance of hinge axis to residue i in
(A) Change in
(deg) Change in
(deg) Angle of psi(i) axis to hinge axis
(deg) Angle of psi(i) axis to hinge axis
(deg) Percentage Progress
GLY-316
LEU-317
13.7
13.6
-0.3
0.6
47.0
49.8
5.9
GLY-316
LEU-317
13.7
13.6
-0.3
0.6
47.0
49.8
5.9
LEU-317
VAL-318
16.9
16.9
-0.9
1.6
79.1
77.7
-51.1
VAL-318
ALA-319
16.4
16.4
-3.3
2.2
51.6
48.4
17.3
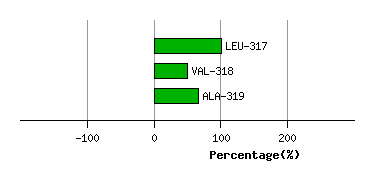
Graph shows rotational transition at bending residues and can be used
to identify hinge bending residues.
Probably only informative for interdomain rotations greater than 20 degrees
Residue
iResidue
i+1Distance of hinge axis to residue i in
(A) Distance of hinge axis to residue i in
(A) Change in
(deg) Change in
(deg) Angle of psi(i) axis to hinge axis
(deg) Angle of psi(i) axis to hinge axis
(deg) Percentage Progress
CYS-324
ALA-325
9.7
9.9
-6.4
-0.1
65.3
66.3
63.3
ALA-325
ASP-326
9.7
9.9
5.2
-1.9
72.8
71.0
26.8
ASP-326
ASP-327
7.1
7.3
1.4
-5.1
103.1
100.9
9.7
ASP-327
PHE-328
4.4
4.6
3.4
-6.3
147.1
148.0
99.4

Graph shows rotational transition at bending residues and can be used
to identify hinge bending residues.
Probably only informative for interdomain rotations greater than 20 degrees
Residue
iResidue
i+1Distance of hinge axis to residue i in
(A) Distance of hinge axis to residue i in
(A) Change in
(deg) Change in
(deg) Angle of psi(i) axis to hinge axis
(deg) Angle of psi(i) axis to hinge axis
(deg) Percentage Progress
ILE-329
LEU-330
6.2
6.3
3.1
-2.1
18.1
17.9
-23.8
LEU-330
THR-331
8.5
8.6
-1.6
9.8
96.4
97.1
14.5
THR-331
VAL-332
10.5
10.6
-1.5
9.6
141.8
135.5
144.3
VAL-332
GLU-333
13.4
13.7
-6.2
13.4
123.4
129.4
142.6
GLU-333
THR-334
14.0
14.1
-15.5
4.7
84.1
82.8
-61.2
THR-334
GLY-335
17.7
17.7
2.8
-0.9
146.0
143.1
-51.5
GLY-335
PRO-336
17.1
17.1
5.5
0.4
29.0
25.9
125.1
GLY-335
PRO-336
17.1
17.1
5.5
0.4
29.0
25.9
125.1

Graph shows rotational transition at bending residues and can be used
to identify hinge bending residues.
Probably only informative for interdomain rotations greater than 20 degrees
Residue
iResidue
i+1Distance of hinge axis to residue i in
(A) Distance of hinge axis to residue i in
(A) Change in
(deg) Change in
(deg) Angle of psi(i) axis to hinge axis
(deg) Angle of psi(i) axis to hinge axis
(deg) Percentage Progress
GLY-335
PRO-336
17.1
17.1
5.5
0.4
29.0
25.9
125.1
GLY-335
PRO-336
17.1
17.1
5.5
0.4
29.0
25.9
125.1
PRO-336
ILE-337
16.4
16.3
7.1
-9.2
83.0
83.8
9.3
ILE-337
GLY-338
13.0
13.0
-1.1
9.4
139.2
141.9
143.7

Graph shows rotational transition at bending residues and can be used
to identify hinge bending residues.
Probably only informative for interdomain rotations greater than 20 degrees
Residue
iResidue
i+1Distance of hinge axis to residue i in
(A) Distance of hinge axis to residue i in
(A) Change in
(deg) Change in
(deg) Angle of psi(i) axis to hinge axis
(deg) Angle of psi(i) axis to hinge axis
(deg) Percentage Progress
ASP-372
VAL-373
1.2
1.2
-0.7
10.7
121.0
118.0
170.8
VAL-373
CYS-374
2.4
2.5
-12.7
10.4
105.7
110.4
-23.3
CYS-374
TYR-375
5.3
5.1
-11.5
10.4
111.0
111.9
68.7
TYR-375
LEU-376
8.7
8.5
3.7
-4.2
129.8
132.1
134.7
TYR-375
LEU-376
8.7
8.5
3.7
-4.2
129.8
132.1
134.7

Graph shows rotational transition at bending residues and can be used
to identify hinge bending residues.
Probably only informative for interdomain rotations greater than 20 degrees
Residue
iResidue
i+1Distance of hinge axis to residue i in
(A) Distance of hinge axis to residue i in
(A) Change in
(deg) Change in
(deg) Angle of psi(i) axis to hinge axis
(deg) Angle of psi(i) axis to hinge axis
(deg) Percentage Progress
TYR-375
LEU-376
8.7
8.5
3.7
-4.2
129.8
132.1
134.7
TYR-375
LEU-376
8.7
8.5
3.7
-4.2
129.8
132.1
134.7
LEU-376
SER-377
10.3
10.2
2.5
-1.1
120.2
116.4
28.9
SER-377
PHE-378
13.4
13.3
11.5
-8.2
163.3
162.4
-20.2

Graph shows rotational transition at bending residues and can be used
to identify hinge bending residues.
Probably only informative for interdomain rotations greater than 20 degrees
Residue
iResidue
i+1Distance of hinge axis to residue i in
(A) Distance of hinge axis to residue i in
(A) Change in
(deg) Change in
(deg) Angle of psi(i) axis to hinge axis
(deg) Angle of psi(i) axis to hinge axis
(deg) Percentage Progress
ALA-379
GLU-380
15.7
15.8
8.2
-4.9
52.2
48.8
70.2
GLU-380
VAL-381
14.0
14.0
-4.7
4.7
81.1
79.2
10.0
VAL-381
ASP-382
11.6
11.6
-1.9
4.2
147.6
150.4
85.4
ASP-382
GLN-383
10.7
10.7
2.1
-2.8
99.4
97.1
-42.4
GLN-383
HIS-384
11.0
11.2
6.4
-2.4
109.0
108.3
-71.0
HIS-384
GLY-385
7.6
7.8
-0.3
-4.2
19.3
17.6
128.5
GLY-385
ASN-386
7.6
7.7
3.8
-2.9
93.3
92.4
-108.2

Graph shows rotational transition at bending residues and can be used
to identify hinge bending residues.
Probably only informative for interdomain rotations greater than 20 degrees
Residue
iResidue
i+1Distance of hinge axis to residue i in
(A) Distance of hinge axis to residue i in
(A) Change in
(deg) Change in
(deg) Angle of psi(i) axis to hinge axis
(deg) Angle of psi(i) axis to hinge axis
(deg) Percentage Progress
LYS-410
LYS-411
2.8
2.7
3.7
-7.8
77.4
76.1
-42.1
LYS-411
ILE-412
2.9
2.9
-4.6
5.5
111.9
112.0
128.5
ILE-412
ILE-413
3.8
3.7
-1.5
-4.6
91.3
90.2
-51.1

Graph shows rotational transition at bending residues and can be used
to identify hinge bending residues.
Probably only informative for interdomain rotations greater than 20 degrees
Residue
iResidue
i+1Distance of hinge axis to residue i in
(A) Distance of hinge axis to residue i in
(A) Change in
(deg) Change in
(deg) Angle of psi(i) axis to hinge axis
(deg) Angle of psi(i) axis to hinge axis
(deg) Percentage Progress
LEU-447
PRO-448
10.1
10.0
-8.7
5.7
43.2
41.0
62.1
PRO-448
GLU-449
11.1
11.0
-6.9
4.6
108.8
111.2
36.6
GLU-449
ILE-450
10.1
10.1
-9.0
9.0
151.7
154.4
62.9
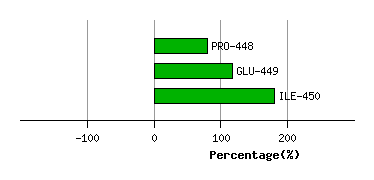
Graph shows rotational transition at bending residues and can be used
to identify hinge bending residues.
Probably only informative for interdomain rotations greater than 20 degrees
Residue
iResidue
i+1Distance of hinge axis to residue i in
(A) Distance of hinge axis to residue i in
(A) Change in
(deg) Change in
(deg) Angle of psi(i) axis to hinge axis
(deg) Angle of psi(i) axis to hinge axis
(deg) Percentage Progress
LEU-462
ASP-463
4.9
4.8
-1.1
0.7
89.0
87.6
-43.1
ASP-463
VAL-464
6.2
6.2
4.3
-4.6
79.5
78.9
72.0
VAL-464
ARG-465
6.2
6.3
-8.1
8.5
83.7
84.0
22.4

Graph shows rotational transition at bending residues and can be used
to identify hinge bending residues.
Probably only informative for interdomain rotations greater than 20 degrees
Residue
iResidue
i+1Distance of hinge axis to residue i in
(A) Distance of hinge axis to residue i in
(A) Change in
(deg) Change in
(deg) Angle of psi(i) axis to hinge axis
(deg) Angle of psi(i) axis to hinge axis
(deg) Percentage Progress
LEU-475
LYS-476
9.7
9.8
-0.6
6.3
92.0
90.4
-48.0
LYS-476
GLU-477
11.4
11.5
-0.5
-1.4
20.4
22.6
110.1
GLU-477
ASP-478
11.8
11.7
-0.6
3.3
38.9
40.7
-87.8
ASP-478
GLY-479
13.7
13.7
3.0
-8.4
89.0
85.6
0.2
GLY-479
LEU-480
12.0
12.0
2.3
0.4
26.1
26.1
64.7

Graph shows rotational transition at bending residues and can be used
to identify hinge bending residues.
Probably only informative for interdomain rotations greater than 20 degrees