Gamma-Crystallin D
(All numbering and residues are taken from first PDB file)
![]()
![]()
Bending Residue Dihedral Analysis
Residue
iResidue
i+1Distance of hinge axis to residue i in
(A) Distance of hinge axis to residue i in
(A) Change in
(deg) Change in
(deg) Angle of psi(i) axis to hinge axis
(deg) Angle of psi(i) axis to hinge axis
(deg) Percentage Progress
LEU-53
GLN-54
2.0
2.1
-0.2
1.4
157.3
154.2
53.4
GLN-54
TYR-55
1.5
1.4
3.8
-8.6
78.7
79.5
5.7
TYR-55
PHE-56
3.7
3.9
-4.3
2.0
173.0
170.8
-21.5
PHE-56
LEU-57
4.4
4.6
-6.9
6.1
104.1
102.8
-31.7
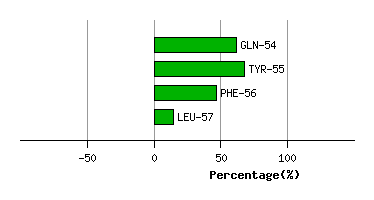
Graph shows rotational transition at bending residues and can be used
to identify hinge bending residues.
Probably only informative for interdomain rotations greater than 20 degrees
Residue
iResidue
i+1Distance of hinge axis to residue i in
(A) Distance of hinge axis to residue i in
(A) Change in
(deg) Change in
(deg) Angle of psi(i) axis to hinge axis
(deg) Angle of psi(i) axis to hinge axis
(deg) Percentage Progress
LEU-80
ILE-81
6.5
6.6
-1.4
1.9
108.5
107.2
-5.2
ILE-81
PRO-82
2.9
3.0
5.1
5.2
9.8
7.7
77.3
PRO-82
HIS-83
2.9
2.9
-3.0
1.1
108.8
108.7
5.0

Graph shows rotational transition at bending residues and can be used
to identify hinge bending residues.
Probably only informative for interdomain rotations greater than 20 degrees
Residue
iResidue
i+1Distance of hinge axis to residue i in
(A) Distance of hinge axis to residue i in
(A) Change in
(deg) Change in
(deg) Angle of psi(i) axis to hinge axis
(deg) Angle of psi(i) axis to hinge axis
(deg) Percentage Progress
ARG-167
ARG-168
10.0
9.9
-10.6
6.6
48.7
45.1
126.6
ARG-168
VAL-169
8.2
8.2
4.8
-6.1
87.0
84.4
7.2
VAL-169
ILE-170
4.9
4.9
-4.0
-2.8
27.8
23.4
67.8
ILE-170
ASP-171
6.6
6.7
10.4
-14.8
77.0
83.0
123.2
ASP-171
PHE-172
8.0
8.4
-37.6
1.8
66.0
53.4
271.1
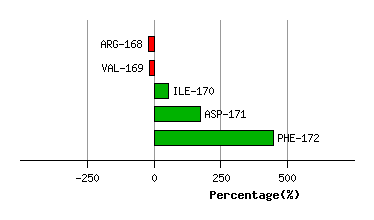
Graph shows rotational transition at bending residues and can be used
to identify hinge bending residues.
Probably only informative for interdomain rotations greater than 20 degrees