Elongation Factor G
(All numbering and residues are taken from first PDB file)
![]()
![]()
Bending Residue Dihedral Analysis
Residue
iResidue
i+1Distance of hinge axis to residue i in
(A) Distance of hinge axis to residue i in
(A) Change in
(deg) Change in
(deg) Angle of psi(i) axis to hinge axis
(deg) Angle of psi(i) axis to hinge axis
(deg) Percentage Progress
GLN-124
ALA-125
9.1
7.4
1.4
-4.7
119.2
119.6
43.5
ALA-125
GLU-126
11.4
10.1
21.2
-12.4
134.3
138.7
-62.0
GLU-126
LYS-127
11.3
9.2
-5.0
-3.6
114.6
108.9
-23.5

Graph shows rotational transition at bending residues and can be used
to identify hinge bending residues.
Probably only informative for interdomain rotations greater than 20 degrees
Residue
iResidue
i+1Distance of hinge axis to residue i in
(A) Distance of hinge axis to residue i in
(A) Change in
(deg) Change in
(deg) Angle of psi(i) axis to hinge axis
(deg) Angle of psi(i) axis to hinge axis
(deg) Percentage Progress
TYR-128
LYS-129
15.4
13.5
-7.3
20.3
139.7
139.6
81.6
LYS-129
VAL-130
15.9
14.3
-22.0
24.1
83.8
84.7
-31.9
VAL-130
PRO-131
16.6
14.8
-25.1
11.2
133.9
137.1
-111.3

Graph shows rotational transition at bending residues and can be used
to identify hinge bending residues.
Probably only informative for interdomain rotations greater than 20 degrees
Residue
iResidue
i+1Distance of hinge axis to residue i in
(A) Distance of hinge axis to residue i in
(A) Change in
(deg) Change in
(deg) Angle of psi(i) axis to hinge axis
(deg) Angle of psi(i) axis to hinge axis
(deg) Percentage Progress
THR-152
MET-153
7.0
8.0
-17.1
6.4
104.1
102.7
-49.4
MET-153
GLN-154
6.7
6.8
5.2
-8.1
131.5
136.4
12.7
GLN-154
GLU-155
5.0
5.4
16.7
-15.2
79.1
87.6
11.7

Graph shows rotational transition at bending residues and can be used
to identify hinge bending residues.
Probably only informative for interdomain rotations greater than 20 degrees
Residue
iResidue
i+1Distance of hinge axis to residue i in
(A) Distance of hinge axis to residue i in
(A) Change in
(deg) Change in
(deg) Angle of psi(i) axis to hinge axis
(deg) Angle of psi(i) axis to hinge axis
(deg) Percentage Progress
GLY-158
ALA-159
4.4
2.6
19.5
-47.5
94.2
89.0
43.7
ALA-159
ARG-160
7.6
6.4
-175.0
-155.3
143.6
144.7
196.6
ARG-160
PRO-161
8.8
8.5
18.8
2.7
102.9
100.7
-45.2

Graph shows rotational transition at bending residues and can be used
to identify hinge bending residues.
Probably only informative for interdomain rotations greater than 20 degrees
Residue
iResidue
i+1Distance of hinge axis to residue i in
(A) Distance of hinge axis to residue i in
(A) Change in
(deg) Change in
(deg) Angle of psi(i) axis to hinge axis
(deg) Angle of psi(i) axis to hinge axis
(deg) Percentage Progress
PRO-436
THR-437
14.5
14.5
-1.6
-9.4
63.6
82.4
91.0
THR-437
PHE-438
13.0
11.6
-93.2
86.3
114.2
141.0
-54.0
PHE-438
ARG-439
10.7
9.1
42.5
-40.2
17.2
35.2
80.3
ARG-439
VAL-440
11.4
10.1
-18.8
35.3
124.6
143.1
92.2
VAL-440
SER-441
9.3
8.8
-35.7
24.7
135.7
116.7
-236.7
SER-441
THR-442
10.3
9.9
-1.7
52.5
122.5
143.6
404.2
THR-442
HIS-443
9.5
10.9
146.7
84.3
95.4
90.3
-101.9
HIS-443
PRO-444
11.4
11.8
3.4
-52.4
32.7
61.1
-426.2
GLN-448
THR-449
7.2
6.8
-107.0
161.5
64.6
45.2
-265.7
THR-449
ILE-450
5.5
4.2
-35.6
-24.4
17.6
25.7
540.9
ILE-450
ILE-451
7.2
5.7
-25.4
32.6
54.5
43.6
-47.9
ILE-451
SER-452
6.3
4.7
3.1
-18.4
141.2
128.1
105.1
SER-452
GLY-453
8.7
7.5
-9.9
-103.0
42.5
32.0
906.4

Graph shows rotational transition at bending residues and can be used
to identify hinge bending residues.
Probably only informative for interdomain rotations greater than 20 degrees
Residue
iResidue
i+1Distance of hinge axis to residue i in
(A) Distance of hinge axis to residue i in
(A) Change in
(deg) Change in
(deg) Angle of psi(i) axis to hinge axis
(deg) Angle of psi(i) axis to hinge axis
(deg) Percentage Progress
GLU-456
LEU-457
5.1
5.2
177.8
110.5
96.5
88.6
-49.1
LEU-457
HIS-458
2.1
2.3
57.7
-20.8
50.3
99.3
-8.8
HIS-458
LEU-459
4.5
1.9
35.9
-2.7
31.3
6.9
280.6
LEU-459
GLU-460
2.8
1.6
-23.6
8.5
87.5
97.6
-0.9
GLU-460
ILE-461
0.8
2.1
24.2
-1.5
83.2
100.6
-55.6
ILE-461
ILE-462
4.0
4.0
-3.7
4.8
158.6
149.9
45.7
ILE-462
VAL-463
4.4
4.5
29.9
-23.6
51.8
50.3
-14.9
VAL-463
ASP-464
2.5
4.2
19.0
-49.6
96.9
99.7
80.6
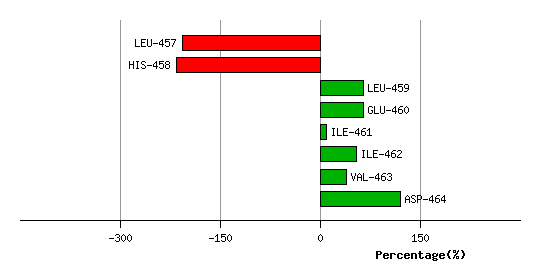
Graph shows rotational transition at bending residues and can be used
to identify hinge bending residues.
Probably only informative for interdomain rotations greater than 20 degrees
Residue
iResidue
i+1Distance of hinge axis to residue i in
(A) Distance of hinge axis to residue i in
(A) Change in
(deg) Change in
(deg) Angle of psi(i) axis to hinge axis
(deg) Angle of psi(i) axis to hinge axis
(deg) Percentage Progress
LYS-478
PRO-479
9.5
10.3
-88.1
-0.6
81.2
54.0
402.2
PRO-479
GLN-480
8.5
8.8
-31.8
15.0
78.2
80.2
152.5
GLN-480
VAL-481
11.8
11.8
6.1
2.0
104.2
107.6
46.9

Graph shows rotational transition at bending residues and can be used
to identify hinge bending residues.
Probably only informative for interdomain rotations greater than 20 degrees