Acetylglutamate Kinase
(All numbering and residues are taken from first PDB file)
![]()
![]()
Bending Residue Dihedral Analysis
Residue
iResidue
i+1Distance of hinge axis to residue i in
(A) Distance of hinge axis to residue i in
(A) Change in
(deg) Change in
(deg) Angle of psi(i) axis to hinge axis
(deg) Angle of psi(i) axis to hinge axis
(deg) Percentage Progress
LYS-8
LEU-9
3.7
3.3
1.9
7.2
52.1
55.4
26.2
LEU-9
GLY-10
4.7
4.3
-3.1
81.7
92.9
83.7
1.0
GLY-10
GLY-11
8.3
7.8
-36.7
-145.7
112.0
155.7
-507.9
GLY-11
VAL-12
11.1
10.4
142.0
16.6
16.8
53.9
622.1
VAL-12
LEU-13
12.9
11.2
-19.5
-5.9
128.7
118.1
-42.1
LEU-13
LEU-14
10.0
7.6
-30.6
5.5
118.2
141.1
-66.8
LEU-14
ASP-15
8.6
7.5
-11.7
11.5
157.7
139.2
-13.1
ASP-15
SER-16
10.9
10.5
-8.4
-6.4
124.1
119.9
-26.1
SER-16
GLU-17
9.6
9.4
-4.1
2.6
114.0
119.5
-6.2
GLU-17
GLU-18
7.0
7.1
9.1
-2.4
101.5
99.9
10.1
GLU-18
ALA-19
8.4
8.6
-4.1
9.1
22.1
32.3
-13.1
ALA-19
LEU-20
7.8
7.2
-2.3
-3.5
85.9
100.8
15.6
LEU-20
GLU-21
4.1
3.7
-5.5
7.0
114.3
119.1
-9.9
GLU-21
ARG-22
4.4
4.6
2.3
-3.8
128.4
128.7
4.6

Graph shows rotational transition at bending residues and can be used
to identify hinge bending residues.
Probably only informative for interdomain rotations greater than 20 degrees
Residue
iResidue
i+1Distance of hinge axis to residue i in
(A) Distance of hinge axis to residue i in
(A) Change in
(deg) Change in
(deg) Angle of psi(i) axis to hinge axis
(deg) Angle of psi(i) axis to hinge axis
(deg) Percentage Progress
GLU-32
SER-33
14.8
16.2
-17.5
5.5
53.4
48.1
32.0
SER-33
HIS-34
16.0
17.8
-14.2
-4.6
15.2
28.5
68.8
HIS-34
GLN-35
14.9
16.3
-3.2
-13.6
89.6
96.2
-26.2
GLN-35
ARG-36
16.2
16.4
29.9
3.9
116.3
131.1
-101.5
ARG-36
PRO-37
13.2
13.7
10.1
2.8
49.0
67.1
46.1
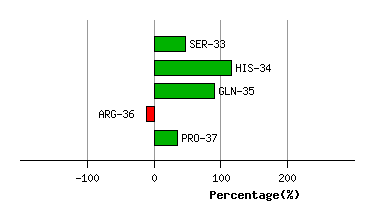
Graph shows rotational transition at bending residues and can be used
to identify hinge bending residues.
Probably only informative for interdomain rotations greater than 20 degrees
Residue
iResidue
i+1Distance of hinge axis to residue i in
(A) Distance of hinge axis to residue i in
(A) Change in
(deg) Change in
(deg) Angle of psi(i) axis to hinge axis
(deg) Angle of psi(i) axis to hinge axis
(deg) Percentage Progress
VAL-41
HIS-42
7.2
6.9
9.9
-22.6
66.6
67.2
-47.3
HIS-42
GLY-43
7.8
7.9
1.3
3.8
100.4
95.4
5.6
GLY-43
GLY-44
10.6
11.1
-7.9
117.6
156.0
158.2
406.9
GLY-44
GLY-45
12.4
13.1
-63.7
115.9
85.5
118.3
-111.5
GLY-45
CYS-46
15.6
12.9
-122.8
-10.3
138.2
112.7
-376.4
CYS-46
VAL-47
15.9
15.8
37.0
-11.0
38.8
52.7
81.2
VAL-47
VAL-48
15.6
15.9
2.9
8.2
99.1
108.6
16.5
VAL-48
ASP-49
18.7
18.4
-2.6
-7.4
95.5
94.8
-6.2

Graph shows rotational transition at bending residues and can be used
to identify hinge bending residues.
Probably only informative for interdomain rotations greater than 20 degrees
Residue
iResidue
i+1Distance of hinge axis to residue i in
(A) Distance of hinge axis to residue i in
(A) Change in
(deg) Change in
(deg) Angle of psi(i) axis to hinge axis
(deg) Angle of psi(i) axis to hinge axis
(deg) Percentage Progress
LEU-178
LEU-179
3.9
3.4
-5.7
-4.7
126.2
129.6
6.4
LEU-179
SER-180
5.4
4.5
1.4
-22.7
69.7
60.6
-45.7
SER-180
ASP-181
9.0
7.7
26.0
0.8
54.5
70.4
57.7

Graph shows rotational transition at bending residues and can be used
to identify hinge bending residues.
Probably only informative for interdomain rotations greater than 20 degrees