DNA Polymerase Eta
(All numbering and residues are taken from first PDB file)
![]()
![]()
Bending Residue Dihedral Analysis
Residue
iResidue
i+1Distance of hinge axis to residue i in
(A) Distance of hinge axis to residue i in
(A) Change in
(deg) Change in
(deg) Angle of psi(i) axis to hinge axis
(deg) Angle of psi(i) axis to hinge axis
(deg) Percentage Progress
ALA-93
VAL-94
3.4
4.0
-4.8
1.8
28.2
23.2
27.5
VAL-94
PHE-95
3.5
3.9
7.4
-3.8
133.4
129.7
-26.5
PHE-95
LYS-96
1.9
2.2
9.1
-7.3
102.7
103.2
-39.6

Graph shows rotational transition at bending residues and can be used
to identify hinge bending residues.
Probably only informative for interdomain rotations greater than 20 degrees
Residue
iResidue
i+1Distance of hinge axis to residue i in
(A) Distance of hinge axis to residue i in
(A) Change in
(deg) Change in
(deg) Angle of psi(i) axis to hinge axis
(deg) Angle of psi(i) axis to hinge axis
(deg) Percentage Progress
GLU-99
ASP-100
3.7
3.8
-3.4
4.1
92.7
96.3
-49.7
ASP-100
PHE-101
3.6
3.6
8.8
-14.6
148.4
149.3
59.1
PHE-101
TRP-102
4.1
3.8
-10.2
4.7
51.4
51.9
45.2
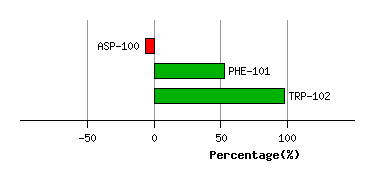
Graph shows rotational transition at bending residues and can be used
to identify hinge bending residues.
Probably only informative for interdomain rotations greater than 20 degrees
Residue
iResidue
i+1Distance of hinge axis to residue i in
(A) Distance of hinge axis to residue i in
(A) Change in
(deg) Change in
(deg) Angle of psi(i) axis to hinge axis
(deg) Angle of psi(i) axis to hinge axis
(deg) Percentage Progress
ASP-114
PRO-115
17.0
17.5
-2.5
-3.6
12.5
16.7
77.6
PRO-115
ALA-116
17.7
18.3
29.2
-25.6
116.8
124.5
-66.0
ALA-116
LYS-117
15.7
15.9
-19.3
26.0
102.9
99.6
9.4
LYS-117
GLN-118
12.5
12.8
-15.7
14.7
68.6
68.5
4.5

Graph shows rotational transition at bending residues and can be used
to identify hinge bending residues.
Probably only informative for interdomain rotations greater than 20 degrees
Residue
iResidue
i+1Distance of hinge axis to residue i in
(A) Distance of hinge axis to residue i in
(A) Change in
(deg) Change in
(deg) Angle of psi(i) axis to hinge axis
(deg) Angle of psi(i) axis to hinge axis
(deg) Percentage Progress
GLU-122
ASP-123
12.9
13.0
4.2
0.4
66.3
65.5
39.6
ASP-123
HIS-124
9.5
9.7
-9.7
3.4
59.6
60.6
14.9
HIS-124
LYS-125
7.3
7.7
-8.0
11.6
100.2
99.3
-24.0

Graph shows rotational transition at bending residues and can be used
to identify hinge bending residues.
Probably only informative for interdomain rotations greater than 20 degrees
Residue
iResidue
i+1Distance of hinge axis to residue i in
(A) Distance of hinge axis to residue i in
(A) Change in
(deg) Change in
(deg) Angle of psi(i) axis to hinge axis
(deg) Angle of psi(i) axis to hinge axis
(deg) Percentage Progress
SER-394
MET-395
19.3
18.9
33.8
-24.7
37.6
35.8
110.7
MET-395
MET-396
16.1
15.7
-13.0
15.3
69.6
72.4
57.3
MET-396
SER-397
14.0
13.8
-14.3
12.5
134.6
132.8
-42.5

Graph shows rotational transition at bending residues and can be used
to identify hinge bending residues.
Probably only informative for interdomain rotations greater than 20 degrees
Residue
iResidue
i+1Distance of hinge axis to residue i in
(A) Distance of hinge axis to residue i in
(A) Change in
(deg) Change in
(deg) Angle of psi(i) axis to hinge axis
(deg) Angle of psi(i) axis to hinge axis
(deg) Percentage Progress
GLN-428
ASP-429
16.3
16.6
-16.9
10.8
37.1
45.9
55.7
ASP-429
LEU-430
17.1
17.3
21.4
-15.7
74.1
67.2
15.1
LEU-430
GLU-431
19.9
19.8
-5.9
7.0
103.0
97.4
29.0
GLU-431
GLN-432
21.1
21.4
3.0
5.8
144.9
149.3
-93.4
GLN-432
GLU-433
21.6
22.1
26.7
-28.2
117.5
104.1
-47.8
GLU-433
TYR-434
22.5
23.6
-5.2
22.4
112.2
120.4
75.0
TYR-434
ASN-435
25.4
26.1
-15.2
6.8
120.8
93.7
-64.2
ASN-435
LYS-436
25.8
26.2
-34.7
23.0
165.4
160.3
-143.2
LYS-436
ILE-437
25.2
26.1
2.8
13.1
61.6
65.9
112.1

Graph shows rotational transition at bending residues and can be used
to identify hinge bending residues.
Probably only informative for interdomain rotations greater than 20 degrees
Residue
iResidue
i+1Distance of hinge axis to residue i in
(A) Distance of hinge axis to residue i in
(A) Change in
(deg) Change in
(deg) Angle of psi(i) axis to hinge axis
(deg) Angle of psi(i) axis to hinge axis
(deg) Percentage Progress
SER-500
MET-501
10.9
10.4
-7.5
7.9
124.4
125.3
-51.2
MET-501
THR-502
9.8
9.5
8.1
-1.5
105.8
106.6
-41.1
THR-502
ILE-503
13.2
12.8
11.4
-11.0
61.9
64.4
28.4
ILE-503
THR-504
14.4
14.3
-2.3
1.3
90.0
89.1
8.5

Graph shows rotational transition at bending residues and can be used
to identify hinge bending residues.
Probably only informative for interdomain rotations greater than 20 degrees