Metabotropic Glutamate Receptor Subtype 1
(All numbering and residues are taken from first PDB file)
![]()
![]()
Bending Residue Dihedral Analysis
Residue
iResidue
i+1Distance of hinge axis to residue i in
(A) Distance of hinge axis to residue i in
(A) Change in
(deg) Change in
(deg) Angle of psi(i) axis to hinge axis
(deg) Angle of psi(i) axis to hinge axis
(deg) Percentage Progress
SER-207
ASP-208
1.2
1.0
9.2
8.4
75.6
70.3
38.1
ASP-208
THR-209
5.0
4.7
-40.3
8.2
63.6
77.9
37.9
THR-209
LEU-210
6.2
6.0
-9.8
33.2
141.2
132.2
66.8
LEU-210
GLN-211
7.0
6.4
0.6
13.9
57.4
53.9
2.8
GLN-211
ALA-212
7.7
7.8
-16.9
18.1
67.3
72.9
-14.3
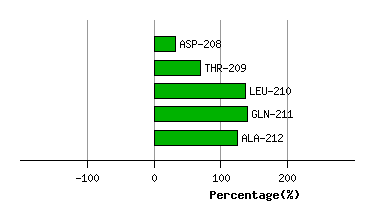
Graph shows rotational transition at bending residues and can be used
to identify hinge bending residues.
Probably only informative for interdomain rotations greater than 20 degrees
Residue
iResidue
i+1Distance of hinge axis to residue i in
(A) Distance of hinge axis to residue i in
(A) Change in
(deg) Change in
(deg) Angle of psi(i) axis to hinge axis
(deg) Angle of psi(i) axis to hinge axis
(deg) Percentage Progress
LEU-342
GLN-343
3.1
2.8
-13.5
10.3
32.6
37.5
18.1
GLN-343
SER-344
1.5
1.8
-8.4
-1.3
84.8
88.7
6.6
SER-344
PRO-345
2.0
1.9
-17.4
-6.2
8.9
10.9
98.1
PRO-345
GLU-346
3.1
2.6
13.0
-15.7
108.0
95.9
22.9
GLU-346
VAL-347
4.9
5.4
9.6
25.1
95.8
98.7
-24.7
VAL-347
ARG-348
8.5
8.7
33.5
2.2
146.0
162.1
-104.8
ARG-348
SER-349
9.6
9.7
-17.4
-0.9
94.2
90.0
29.3

Graph shows rotational transition at bending residues and can be used
to identify hinge bending residues.
Probably only informative for interdomain rotations greater than 20 degrees
Residue
iResidue
i+1Distance of hinge axis to residue i in
(A) Distance of hinge axis to residue i in
(A) Change in
(deg) Change in
(deg) Angle of psi(i) axis to hinge axis
(deg) Angle of psi(i) axis to hinge axis
(deg) Percentage Progress
ASP-474
ALA-475
5.5
5.6
21.9
-4.6
38.8
37.1
45.6
ALA-475
PRO-476
6.3
6.1
9.1
1.6
66.7
76.3
40.1
PRO-476
GLY-477
6.5
7.1
-1.3
95.8
135.3
123.1
210.1
GLY-477
ARG-478
4.1
6.2
-38.9
4.4
104.0
170.4
-93.7
ARG-478
TYR-479
5.0
5.5
-116.4
45.7
117.9
113.9
-94.3
TYR-479
ASP-480
5.5
6.0
-9.5
1.1
150.1
153.8
-16.9
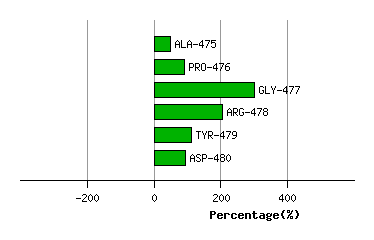
Graph shows rotational transition at bending residues and can be used
to identify hinge bending residues.
Probably only informative for interdomain rotations greater than 20 degrees