R-Alcohol Dehydrogenase
(All numbering and residues are taken from first PDB file)
![]()
![]()
Bending Residue Dihedral Analysis
Residue
iResidue
i+1Distance of hinge axis to residue i in
(A) Distance of hinge axis to residue i in
(A) Change in
(deg) Change in
(deg) Angle of psi(i) axis to hinge axis
(deg) Angle of psi(i) axis to hinge axis
(deg) Percentage Progress
ASP-67
GLY-68
7.7
7.8
1.0
-1.8
148.6
149.6
3.9
GLY-68
TRP-69
9.8
9.9
1.4
1.6
139.2
139.1
-24.5
TRP-69
THR-70
6.8
6.8
-3.2
2.5
85.8
85.5
-92.3
THR-70
LYS-71
6.1
6.1
2.8
-2.4
116.9
116.5
16.4

Graph shows rotational transition at bending residues and can be used
to identify hinge bending residues.
Probably only informative for interdomain rotations greater than 20 degrees
Residue
iResidue
i+1Distance of hinge axis to residue i in
(A) Distance of hinge axis to residue i in
(A) Change in
(deg) Change in
(deg) Angle of psi(i) axis to hinge axis
(deg) Angle of psi(i) axis to hinge axis
(deg) Percentage Progress
LEU-86
VAL-87
3.9
4.0
3.6
-4.4
107.0
108.0
87.9
VAL-87
ASN-88
7.6
7.7
-2.0
3.3
141.5
142.2
-71.8
ASN-88
ASN-89
9.7
9.8
1.7
-3.3
108.0
109.7
112.1
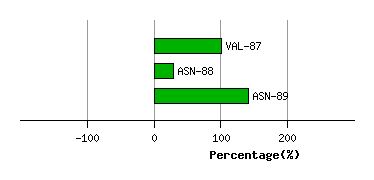
Graph shows rotational transition at bending residues and can be used
to identify hinge bending residues.
Probably only informative for interdomain rotations greater than 20 degrees
Residue
iResidue
i+1Distance of hinge axis to residue i in
(A) Distance of hinge axis to residue i in
(A) Change in
(deg) Change in
(deg) Angle of psi(i) axis to hinge axis
(deg) Angle of psi(i) axis to hinge axis
(deg) Percentage Progress
ALA-135
SER-136
5.0
4.9
-0.8
0.9
92.7
92.5
-62.6
SER-136
ILE-137
5.1
5.1
-1.4
-0.2
54.4
53.8
113.9
ILE-137
ILE-138
6.0
6.1
3.8
-7.8
67.5
67.4
-131.7
ILE-138
ASN-139
8.7
8.8
2.8
-7.4
132.2
130.8
134.0

Graph shows rotational transition at bending residues and can be used
to identify hinge bending residues.
Probably only informative for interdomain rotations greater than 20 degrees