Histidinol-Phosphate Aminotransferase
(All numbering and residues are taken from first PDB file)
![]()
![]()
Bending Residue Dihedral Analysis
Residue
iResidue
i+1Distance of hinge axis to residue i in
(A) Distance of hinge axis to residue i in
(A) Change in
(deg) Change in
(deg) Angle of psi(i) axis to hinge axis
(deg) Angle of psi(i) axis to hinge axis
(deg) Percentage Progress
VAL-28
ASP-29
20.2
19.8
-35.6
27.0
52.7
47.1
30.5
ASP-29
ILE-30
18.4
18.6
9.1
-13.4
83.3
80.8
114.8
ILE-30
ARG-31
15.6
15.6
-0.6
-0.9
144.7
130.9
-29.0
ARG-31
LEU-32
13.2
13.1
-0.6
-16.7
101.4
101.4
46.9

Graph shows rotational transition at bending residues and can be used
to identify hinge bending residues.
Probably only informative for interdomain rotations greater than 20 degrees
Residue
iResidue
i+1Distance of hinge axis to residue i in
(A) Distance of hinge axis to residue i in
(A) Change in
(deg) Change in
(deg) Angle of psi(i) axis to hinge axis
(deg) Angle of psi(i) axis to hinge axis
(deg) Percentage Progress
ASN-35
GLU-36
4.4
4.7
-33.5
48.1
151.0
157.7
109.1
GLU-36
ASN-37
4.5
5.5
-13.1
7.8
131.3
118.5
-130.0
ASN-37
PRO-38
2.7
3.1
11.3
0.5
55.3
58.3
-5.6
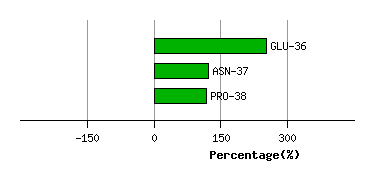
Graph shows rotational transition at bending residues and can be used
to identify hinge bending residues.
Probably only informative for interdomain rotations greater than 20 degrees
Residue
iResidue
i+1Distance of hinge axis to residue i in
(A) Distance of hinge axis to residue i in
(A) Change in
(deg) Change in
(deg) Angle of psi(i) axis to hinge axis
(deg) Angle of psi(i) axis to hinge axis
(deg) Percentage Progress
GLY-279
THR-280
7.2
6.7
15.4
7.5
60.1
59.6
109.5
THR-280
VAL-281
4.5
4.4
8.9
12.2
8.1
19.2
182.8
VAL-281
GLU-282
5.1
5.8
3.0
-12.2
76.6
84.4
-65.0
GLU-282
LYS-283
8.8
9.2
-0.6
5.9
95.8
95.7
30.6

Graph shows rotational transition at bending residues and can be used
to identify hinge bending residues.
Probably only informative for interdomain rotations greater than 20 degrees