D-Mandelate Dehydrogenase
(All numbering and residues are taken from first PDB file)
![]()
![]()
Bending Residue Dihedral Analysis
Residue
iResidue
i+1Distance of hinge axis to residue i in
(A) Distance of hinge axis to residue i in
(A) Change in
(deg) Change in
(deg) Angle of psi(i) axis to hinge axis
(deg) Angle of psi(i) axis to hinge axis
(deg) Percentage Progress
ASN-108
SER-109
1.7
1.6
-10.4
5.9
28.5
25.6
56.2
SER-109
ARG-110
2.7
2.5
7.4
-3.8
109.7
104.7
10.7
ARG-110
GLY-111
6.3
6.2
-2.7
-0.1
44.3
37.4
9.8
GLY-111
ALA-112
8.2
8.0
4.2
-17.2
148.2
146.4
92.8
ALA-112
GLY-113
5.1
5.0
21.9
-6.2
132.6
125.9
-78.7
GLY-113
ASP-114
7.0
7.0
-29.1
12.2
86.3
77.1
19.4
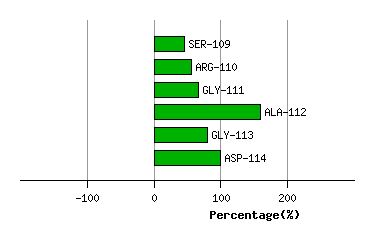
Graph shows rotational transition at bending residues and can be used
to identify hinge bending residues.
Probably only informative for interdomain rotations greater than 20 degrees
Residue
iResidue
i+1Distance of hinge axis to residue i in
(A) Distance of hinge axis to residue i in
(A) Change in
(deg) Change in
(deg) Angle of psi(i) axis to hinge axis
(deg) Angle of psi(i) axis to hinge axis
(deg) Percentage Progress
PHE-313
HIS-314
2.2
2.4
0.3
-0.1
87.4
86.9
9.7
HIS-314
GLU-315
2.7
2.7
-4.1
-1.3
39.0
37.2
30.6
GLU-315
PHE-316
3.0
2.9
1.9
-9.2
156.5
152.2
21.7
PHE-316
GLU-317
1.5
1.4
6.2
-5.1
100.2
96.9
23.7
GLU-317
ARG-318
5.2
5.1
-0.4
-0.8
83.3
81.1
-23.5
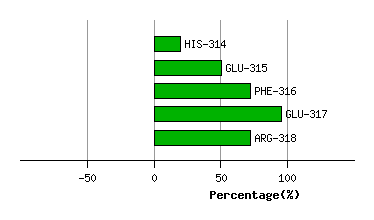
Graph shows rotational transition at bending residues and can be used
to identify hinge bending residues.
Probably only informative for interdomain rotations greater than 20 degrees