Transcriptional Regulator (Ntrc Family)
(All numbering and residues are taken from first PDB file)
![]()
![]()
Bending Residue Dihedral Analysis
Residue
iResidue
i+1Distance of hinge axis to residue i in
(A) Distance of hinge axis to residue i in
(A) Change in
(deg) Change in
(deg) Angle of psi(i) axis to hinge axis
(deg) Angle of psi(i) axis to hinge axis
(deg) Percentage Progress
GLU-131
LYS-132
26.8
26.4
0.5
-0.3
75.0
75.6
5.4
LYS-132
ASP-133
23.7
23.1
-7.5
3.0
146.4
146.7
-32.9
ASP-133
LEU-134
25.3
24.5
4.0
-24.9
33.4
29.7
-181.2
LEU-134
LYS-135
25.4
25.1
12.4
0.8
69.0
74.3
42.5
LYS-135
GLU-136
21.7
21.6
-13.7
-41.4
104.3
111.2
-119.8
TYR-139
VAL-140
16.5
17.2
-30.6
8.6
144.2
155.9
-199.1
VAL-140
PHE-141
15.3
16.2
-13.4
-17.0
83.2
94.5
-10.9
PHE-141
GLU-142
15.4
15.0
27.6
1.1
33.3
58.7
220.6

Graph shows rotational transition at bending residues and can be used
to identify hinge bending residues.
Probably only informative for interdomain rotations greater than 20 degrees
Residue
iResidue
i+1Distance of hinge axis to residue i in
(A) Distance of hinge axis to residue i in
(A) Change in
(deg) Change in
(deg) Angle of psi(i) axis to hinge axis
(deg) Angle of psi(i) axis to hinge axis
(deg) Percentage Progress
PRO-144
LYS-145
16.8
17.2
17.1
-15.2
18.6
20.8
-4.7
LYS-145
MET-146
15.1
15.4
8.4
6.2
48.2
45.8
128.5
MET-146
LYS-147
14.6
15.2
7.9
-13.1
88.8
83.9
34.4
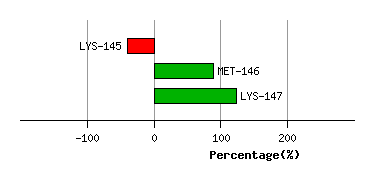
Graph shows rotational transition at bending residues and can be used
to identify hinge bending residues.
Probably only informative for interdomain rotations greater than 20 degrees
Residue
iResidue
i+1Distance of hinge axis to residue i in
(A) Distance of hinge axis to residue i in
(A) Change in
(deg) Change in
(deg) Angle of psi(i) axis to hinge axis
(deg) Angle of psi(i) axis to hinge axis
(deg) Percentage Progress
GLU-151
LYS-152
22.0
22.8
1.8
-1.9
154.6
152.1
9.9
LYS-152
ILE-153
20.9
21.5
-1.2
0.9
46.0
41.9
13.6
ILE-153
LYS-154
19.4
20.9
-0.2
3.0
75.2
77.2
-2.7
LYS-154
LYS-155
23.0
24.6
-2.5
6.9
50.3
53.0
-25.7
LYS-155
ILE-156
24.3
25.5
17.3
17.1
158.2
167.1
-312.9
ILE-156
SER-157
21.8
23.7
115.4
-50.5
117.1
120.9
-357.5
SER-157
CYS-158
21.8
26.6
28.8
23.8
150.5
162.9
-515.8
CYS-158
ALA-159
24.5
24.6
125.3
-8.7
137.4
99.8
2279.8
ALA-159
GLU-160
23.0
24.0
158.6
-5.0
133.6
114.3
-794.8
GLU-160
CYS-161
21.3
21.0
0.5
19.2
100.4
76.9
10.2
CYS-161
PRO-162
18.9
19.5
-32.7
9.1
125.6
116.6
-106.1
PRO-162
VAL-163
15.3
15.8
9.1
-18.5
25.8
20.1
-111.1
VAL-163
LEU-164
14.2
14.8
-5.1
11.7
95.4
102.0
9.9
LEU-164
ILE-165
11.2
11.7
17.4
-16.0
8.1
8.3
25.5
ILE-165
THR-166
9.7
10.2
-4.8
-2.4
105.1
105.6
2.6
THR-166
GLY-167
8.0
8.1
-5.0
23.4
162.9
166.5
177.8
GLY-167
GLU-168
6.1
6.1
-0.4
0.1
92.1
91.8
34.0
GLU-168
SER-169
3.3
3.5
15.4
4.7
101.4
105.7
5.3
SER-169
GLY-170
0.4
0.8
-10.8
10.9
145.4
137.0
6.5
GLY-170
VAL-171
3.5
3.0
-16.9
2.1
121.1
105.1
16.5
VAL-171
GLY-172
4.5
4.5
154.3
165.8
99.1
131.8
148.4
GLY-172
LYS-173
7.8
7.9
93.0
-46.5
149.0
120.0
-331.2
LYS-173
GLU-174
7.7
9.0
31.9
-1.4
121.8
119.6
-139.6
GLU-174
VAL-175
9.5
11.6
-3.7
4.2
117.0
117.9
-1.5

Graph shows rotational transition at bending residues and can be used
to identify hinge bending residues.
Probably only informative for interdomain rotations greater than 20 degrees
Residue
iResidue
i+1Distance of hinge axis to residue i in
(A) Distance of hinge axis to residue i in
(A) Change in
(deg) Change in
(deg) Angle of psi(i) axis to hinge axis
(deg) Angle of psi(i) axis to hinge axis
(deg) Percentage Progress
ASN-195
VAL-196
6.5
8.8
-14.6
-0.3
41.1
48.1
77.2
VAL-196
ALA-197
4.2
6.1
1.8
-16.7
80.3
76.5
13.6
ALA-197
SER-198
5.0
6.2
36.1
-26.3
93.3
83.0
-9.0
SER-198
ILE-199
8.5
10.0
19.6
-30.5
149.6
150.6
94.7
ILE-199
PRO-200
9.1
10.5
-7.5
-3.3
51.6
57.1
100.3
PRO-200
ARG-201
9.8
10.5
21.1
-2.1
129.9
135.7
-137.9
ARG-201
ASP-202
6.9
7.4
-22.8
27.2
18.9
29.1
-65.6
ASP-202
ILE-203
8.7
9.0
-44.7
45.1
80.0
90.4
25.3
ILE-203
PHE-204
9.8
11.2
-0.6
-24.0
102.3
111.2
-52.7
PHE-204
GLU-205
7.2
8.8
6.5
-3.2
133.6
133.7
-37.9
GLU-205
ALA-206
6.0
6.6
6.7
-3.3
117.3
132.2
2.8
ALA-206
GLU-207
9.3
9.7
-13.3
20.4
126.2
112.5
33.8
GLU-207
LEU-208
11.0
11.8
-3.3
3.2
100.6
92.8
-24.2
LEU-208
PHE-209
9.5
9.9
-0.1
-10.5
34.5
33.0
75.5
PHE-209
GLY-210
9.6
9.5
7.1
-7.0
127.6
133.8
17.7
GLY-210
TYR-211
11.9
11.7
10.0
0.1
148.3
141.2
-71.1

Graph shows rotational transition at bending residues and can be used
to identify hinge bending residues.
Probably only informative for interdomain rotations greater than 20 degrees
Residue
iResidue
i+1Distance of hinge axis to residue i in
(A) Distance of hinge axis to residue i in
(A) Change in
(deg) Change in
(deg) Angle of psi(i) axis to hinge axis
(deg) Angle of psi(i) axis to hinge axis
(deg) Percentage Progress
THR-234
LEU-235
16.8
17.8
-9.3
2.3
94.9
87.3
15.6
LEU-235
PHE-236
13.2
14.3
-8.3
9.7
48.4
50.9
-15.7
PHE-236
LEU-237
10.7
11.9
-5.7
9.8
104.4
99.5
2.4

Graph shows rotational transition at bending residues and can be used
to identify hinge bending residues.
Probably only informative for interdomain rotations greater than 20 degrees
Residue
iResidue
i+1Distance of hinge axis to residue i in
(A) Distance of hinge axis to residue i in
(A) Change in
(deg) Change in
(deg) Angle of psi(i) axis to hinge axis
(deg) Angle of psi(i) axis to hinge axis
(deg) Percentage Progress
LEU-243
SER-244
1.1
0.1
-9.6
3.9
50.5
56.3
55.1
SER-244
LEU-245
3.2
2.4
7.4
0.5
111.3
112.5
-63.2
LEU-245
GLU-246
5.4
4.3
3.8
-12.9
139.1
135.5
32.3

Graph shows rotational transition at bending residues and can be used
to identify hinge bending residues.
Probably only informative for interdomain rotations greater than 20 degrees
Residue
iResidue
i+1Distance of hinge axis to residue i in
(A) Distance of hinge axis to residue i in
(A) Change in
(deg) Change in
(deg) Angle of psi(i) axis to hinge axis
(deg) Angle of psi(i) axis to hinge axis
(deg) Percentage Progress
ILE-269
GLU-270
15.6
14.9
-8.4
-9.7
42.4
56.1
72.3
GLU-270
VAL-271
17.7
17.4
-23.7
3.7
37.6
34.2
122.8
VAL-271
ASN-272
18.3
18.2
3.7
-3.5
132.8
128.5
14.6

Graph shows rotational transition at bending residues and can be used
to identify hinge bending residues.
Probably only informative for interdomain rotations greater than 20 degrees
Residue
iResidue
i+1Distance of hinge axis to residue i in
(A) Distance of hinge axis to residue i in
(A) Change in
(deg) Change in
(deg) Angle of psi(i) axis to hinge axis
(deg) Angle of psi(i) axis to hinge axis
(deg) Percentage Progress
VAL-273
ARG-274
17.4
17.4
3.7
-9.6
55.5
49.9
13.7
ARG-274
ILE-275
16.9
17.3
-9.1
9.7
104.0
116.3
16.5
ILE-275
LEU-276
13.2
13.8
-4.0
6.6
153.8
161.3
-47.9

Graph shows rotational transition at bending residues and can be used
to identify hinge bending residues.
Probably only informative for interdomain rotations greater than 20 degrees
Residue
iResidue
i+1Distance of hinge axis to residue i in
(A) Distance of hinge axis to residue i in
(A) Change in
(deg) Change in
(deg) Angle of psi(i) axis to hinge axis
(deg) Angle of psi(i) axis to hinge axis
(deg) Percentage Progress
VAL-287
LYS-288
13.4
12.1
-2.1
-3.4
102.8
103.2
-35.4
LYS-288
GLU-289
16.6
15.4
17.5
-18.3
62.8
67.7
-0.9
GLU-289
GLY-290
15.4
14.1
2.9
12.4
23.6
26.3
136.8

Graph shows rotational transition at bending residues and can be used
to identify hinge bending residues.
Probably only informative for interdomain rotations greater than 20 degrees
Residue
iResidue
i+1Distance of hinge axis to residue i in
(A) Distance of hinge axis to residue i in
(A) Change in
(deg) Change in
(deg) Angle of psi(i) axis to hinge axis
(deg) Angle of psi(i) axis to hinge axis
(deg) Percentage Progress
LYS-291
PHE-292
10.5
9.1
18.5
-23.1
88.6
87.0
15.1
PHE-292
ARG-293
9.4
8.2
19.1
-25.4
115.0
118.3
-17.6
ARG-293
GLU-294
10.9
9.9
5.6
4.6
52.4
54.1
45.6

Graph shows rotational transition at bending residues and can be used
to identify hinge bending residues.
Probably only informative for interdomain rotations greater than 20 degrees
Residue
iResidue
i+1Distance of hinge axis to residue i in
(A) Distance of hinge axis to residue i in
(A) Change in
(deg) Change in
(deg) Angle of psi(i) axis to hinge axis
(deg) Angle of psi(i) axis to hinge axis
(deg) Percentage Progress
LEU-296
TYR-297
11.6
11.1
6.2
-7.8
166.8
170.7
15.8
TYR-297
TYR-298
12.3
11.6
-4.3
7.1
76.1
75.8
-22.7
TYR-298
ARG-299
15.9
15.3
1.2
0.6
88.7
87.6
7.5

Graph shows rotational transition at bending residues and can be used
to identify hinge bending residues.
Probably only informative for interdomain rotations greater than 20 degrees
Residue
iResidue
i+1Distance of hinge axis to residue i in
(A) Distance of hinge axis to residue i in
(A) Change in
(deg) Change in
(deg) Angle of psi(i) axis to hinge axis
(deg) Angle of psi(i) axis to hinge axis
(deg) Percentage Progress
GLU-304
ILE-305
15.1
15.0
-2.9
9.9
163.4
162.4
39.0
ILE-305
GLU-306
13.8
14.1
-12.8
14.9
112.8
114.3
23.8
GLU-306
ILE-307
11.9
12.0
-8.0
13.3
147.1
147.5
43.8

Graph shows rotational transition at bending residues and can be used
to identify hinge bending residues.
Probably only informative for interdomain rotations greater than 20 degrees