Scytalidopepsin B
(All numbering and residues are taken from first PDB file)
![]()
![]()
Bending Residue Dihedral Analysis
Residue
iResidue
i+1Distance of hinge axis to residue i in
(A) Distance of hinge axis to residue i in
(A) Change in
(deg) Change in
(deg) Angle of psi(i) axis to hinge axis
(deg) Angle of psi(i) axis to hinge axis
(deg) Percentage Progress
ILE-134
ILE-135
9.2
8.9
-2.9
5.4
37.8
37.9
7.8
ILE-135
GLU-136
6.1
5.8
10.6
-3.9
94.3
93.2
35.0
GLU-136
ASP-137
6.0
5.6
4.4
-4.8
133.5
134.9
12.2
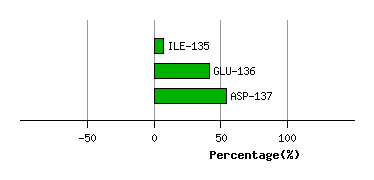
Graph shows rotational transition at bending residues and can be used
to identify hinge bending residues.
Probably only informative for interdomain rotations greater than 20 degrees
Residue
iResidue
i+1Distance of hinge axis to residue i in
(A) Distance of hinge axis to residue i in
(A) Change in
(deg) Change in
(deg) Angle of psi(i) axis to hinge axis
(deg) Angle of psi(i) axis to hinge axis
(deg) Percentage Progress
PRO-152
PHE-153
6.7
6.8
0.6
1.1
111.3
106.0
-14.8
PHE-153
ALA-154
3.8
3.8
10.9
-8.2
72.3
70.6
41.0
ALA-154
SER-155
2.6
3.2
17.7
-12.4
132.4
136.2
-35.9
SER-155
PHE-156
5.2
5.8
-1.2
3.2
109.1
106.5
9.1

Graph shows rotational transition at bending residues and can be used
to identify hinge bending residues.
Probably only informative for interdomain rotations greater than 20 degrees
Residue
iResidue
i+1Distance of hinge axis to residue i in
(A) Distance of hinge axis to residue i in
(A) Change in
(deg) Change in
(deg) Angle of psi(i) axis to hinge axis
(deg) Angle of psi(i) axis to hinge axis
(deg) Percentage Progress
GLN-180
ILE-181
9.4
9.1
-5.5
2.8
42.8
39.6
-2.8
ILE-181
THR-182
6.3
6.1
10.5
-7.7
109.8
109.6
30.6
THR-182
GLN-183
4.9
4.7
2.2
-4.9
130.8
129.5
36.6
GLN-183
VAL-184
2.1
1.9
3.4
-3.0
132.8
130.9
-11.7

Graph shows rotational transition at bending residues and can be used
to identify hinge bending residues.
Probably only informative for interdomain rotations greater than 20 degrees
Residue
iResidue
i+1Distance of hinge axis to residue i in
(A) Distance of hinge axis to residue i in
(A) Change in
(deg) Change in
(deg) Angle of psi(i) axis to hinge axis
(deg) Angle of psi(i) axis to hinge axis
(deg) Percentage Progress
VAL-191
THR-192
4.3
4.5
1.8
-3.3
86.7
86.9
52.5
THR-192
ASP-193
2.6
2.8
-5.5
7.7
20.1
18.6
-23.9
ASP-193
CYS-194
4.5
4.7
0.9
0.2
91.0
85.6
25.5
CYS-194
SER-195
5.3
5.5
-13.8
17.7
23.6
19.3
-20.5

Graph shows rotational transition at bending residues and can be used
to identify hinge bending residues.
Probably only informative for interdomain rotations greater than 20 degrees