Shikimate 5-Dehydrogenase
(All numbering and residues are taken from first PDB file)
![]()
![]()
Bending Residue Dihedral Analysis
Residue
iResidue
i+1Distance of hinge axis to residue i in
(A) Distance of hinge axis to residue i in
(A) Change in
(deg) Change in
(deg) Angle of psi(i) axis to hinge axis
(deg) Angle of psi(i) axis to hinge axis
(deg) Percentage Progress
GLU-77
ARG-78
3.9
4.0
0.8
-1.7
46.5
44.9
-6.3
ARG-78
ALA-79
4.7
4.8
3.9
0.7
90.8
86.7
-14.6
ALA-79
ALA-80
3.8
3.7
-3.6
1.0
32.9
40.3
22.7
ALA-80
LEU-81
4.8
5.1
-1.8
2.9
91.4
98.4
-6.4
LEU-81
ALA-82
7.8
8.0
5.9
-4.3
49.5
42.7
-0.8
ALA-82
GLY-83
8.8
8.5
8.2
-9.8
109.6
107.5
-7.4
GLY-83
ALA-84
9.5
9.5
-3.2
-4.9
139.4
129.3
-36.8
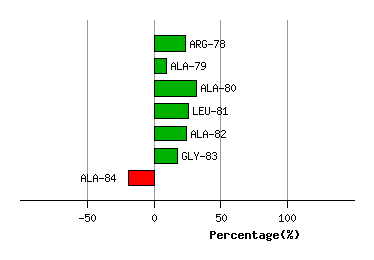
Graph shows rotational transition at bending residues and can be used
to identify hinge bending residues.
Probably only informative for interdomain rotations greater than 20 degrees
Residue
iResidue
i+1Distance of hinge axis to residue i in
(A) Distance of hinge axis to residue i in
(A) Change in
(deg) Change in
(deg) Angle of psi(i) axis to hinge axis
(deg) Angle of psi(i) axis to hinge axis
(deg) Percentage Progress
ASP-99
ASN-100
2.2
2.2
-2.4
-4.4
131.1
130.1
-42.8
ASN-100
THR-101
2.7
2.7
0.3
3.6
45.7
49.4
90.6
THR-101
ASP-102
1.6
1.6
7.1
-5.0
51.2
51.8
4.4

Graph shows rotational transition at bending residues and can be used
to identify hinge bending residues.
Probably only informative for interdomain rotations greater than 20 degrees
Residue
iResidue
i+1Distance of hinge axis to residue i in
(A) Distance of hinge axis to residue i in
(A) Change in
(deg) Change in
(deg) Angle of psi(i) axis to hinge axis
(deg) Angle of psi(i) axis to hinge axis
(deg) Percentage Progress
GLN-244
ALA-245
1.0
0.9
2.6
-4.8
88.3
89.7
2.3
ALA-245
ALA-246
3.0
2.8
3.0
-1.5
82.8
83.9
11.5
ALA-246
HIS-247
4.3
4.4
1.7
-1.8
18.5
19.7
-5.9

Graph shows rotational transition at bending residues and can be used
to identify hinge bending residues.
Probably only informative for interdomain rotations greater than 20 degrees
Residue
iResidue
i+1Distance of hinge axis to residue i in
(A) Distance of hinge axis to residue i in
(A) Change in
(deg) Change in
(deg) Angle of psi(i) axis to hinge axis
(deg) Angle of psi(i) axis to hinge axis
(deg) Percentage Progress
PRO-261
VAL-262
5.6
5.6
-1.2
-0.3
80.4
80.0
-2.4
VAL-262
ILE-263
3.4
3.5
3.2
-1.4
79.5
81.0
-18.5
ILE-263
LYS-264
1.1
1.1
0.5
4.2
6.0
9.5
50.6
LYS-264
GLN-265
1.9
1.6
-0.8
3.6
116.6
110.2
-16.5
GLN-265
LEU-266
2.3
2.6
1.1
-2.3
99.3
100.4
26.5
LEU-266
GLN-267
3.6
3.7
3.6
-2.8
63.4
60.6
10.7
GLN-267
GLU-268
4.0
4.1
-3.4
-10.9
164.1
158.1
-143.0

Graph shows rotational transition at bending residues and can be used
to identify hinge bending residues.
Probably only informative for interdomain rotations greater than 20 degrees