Dna-Directed RNA Polymerase II Largest Subunit
(All numbering and residues are taken from first PDB file)
![]()
![]()
Bending Residue Dihedral Analysis
Residue
iResidue
i+1Distance of hinge axis to residue i in
(A) Distance of hinge axis to residue i in
(A) Change in
(deg) Change in
(deg) Angle of psi(i) axis to hinge axis
(deg) Angle of psi(i) axis to hinge axis
(deg) Percentage Progress
ASN-339
LEU-340
8.5
9.9
20.8
-25.5
106.8
118.0
22.7
LEU-340
MET-341
6.0
7.7
42.5
-33.9
43.7
49.5
32.0
MET-341
GLY-342
5.9
7.2
1.3
0.3
45.7
46.9
19.3
GLY-342
LYS-343
4.5
5.0
57.8
-60.3
31.2
25.8
-8.8
LYS-343
ARG-344
7.3
7.5
2.8
2.1
71.4
71.1
12.9

Graph shows rotational transition at bending residues and can be used
to identify hinge bending residues.
Probably only informative for interdomain rotations greater than 20 degrees
Residue
iResidue
i+1Distance of hinge axis to residue i in
(A) Distance of hinge axis to residue i in
(A) Change in
(deg) Change in
(deg) Angle of psi(i) axis to hinge axis
(deg) Angle of psi(i) axis to hinge axis
(deg) Percentage Progress
ALA-1396
LEU-1397
12.1
12.2
-21.0
27.4
62.9
63.6
-58.8
LEU-1397
MET-1398
10.3
10.2
1.3
-2.7
150.3
154.0
17.3
MET-1398
ARG-1399
8.2
8.4
19.3
-34.6
136.7
136.0
93.8

Graph shows rotational transition at bending residues and can be used
to identify hinge bending residues.
Probably only informative for interdomain rotations greater than 20 degrees
Residue
iResidue
i+1Distance of hinge axis to residue i in
(A) Distance of hinge axis to residue i in
(A) Change in
(deg) Change in
(deg) Angle of psi(i) axis to hinge axis
(deg) Angle of psi(i) axis to hinge axis
(deg) Percentage Progress
LEU-1418
ASP-1419
9.9
10.1
9.6
2.9
39.9
38.9
69.6
ASP-1419
ASP-1420
7.9
7.9
-13.4
6.9
76.8
74.5
5.6
ASP-1420
CYS-1421
4.8
5.0
-6.9
9.9
124.2
120.9
-12.2
CYS-1421
ARG-1422
2.9
2.9
1.3
-0.5
76.9
71.4
24.2
ARG-1422
GLY-1423
2.7
3.1
-16.5
25.9
169.8
173.5
62.7
GLY-1423
VAL-1424
3.1
3.6
36.4
-44.3
56.6
60.3
-66.1
VAL-1424
SER-1425
0.7
1.2
13.6
4.6
78.2
79.9
20.8
SER-1425
GLU-1426
3.4
4.1
-19.6
13.5
40.6
37.1
13.3
GLU-1426
ASN-1427
5.0
5.2
-1.1
-3.5
75.4
79.3
0.4
ASN-1427
VAL-1428
4.0
3.7
-1.7
-11.5
136.6
136.3
-71.0
VAL-1428
ILE-1429
5.6
5.5
11.6
-4.2
105.4
102.4
0.3
ILE-1429
LEU-1430
8.6
8.4
-15.5
14.3
39.3
41.9
13.9
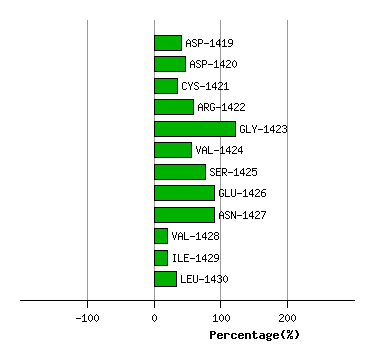
Graph shows rotational transition at bending residues and can be used
to identify hinge bending residues.
Probably only informative for interdomain rotations greater than 20 degrees
Residue
iResidue
i+1Distance of hinge axis to residue i in
(A) Distance of hinge axis to residue i in
(A) Change in
(deg) Change in
(deg) Angle of psi(i) axis to hinge axis
(deg) Angle of psi(i) axis to hinge axis
(deg) Percentage Progress
GLN-1432
MET-1433
7.1
7.1
2.2
-2.1
59.4
59.7
4.3
MET-1433
ALA-1434
5.9
5.9
-4.3
12.7
54.1
57.3
5.7
ALA-1434
PRO-1435
3.2
3.3
-14.6
5.5
64.9
60.0
32.0

Graph shows rotational transition at bending residues and can be used
to identify hinge bending residues.
Probably only informative for interdomain rotations greater than 20 degrees