Glutamate Receptor Ionotropic, Nmda 1
(All numbering and residues are taken from first PDB file)
![]()
![]()
Bending Residue Dihedral Analysis
Residue
iResidue
i+1Distance of hinge axis to residue i in
(A) Distance of hinge axis to residue i in
(A) Change in
(deg) Change in
(deg) Angle of psi(i) axis to hinge axis
(deg) Angle of psi(i) axis to hinge axis
(deg) Percentage Progress
GLN-144
GLY-145
9.3
9.4
-2.2
3.1
50.4
52.6
29.5
GLY-145
LEU-146
9.9
9.9
0.4
0.4
150.4
149.0
-26.1
LEU-146
THR-147
9.2
9.2
1.7
-3.4
129.4
130.4
38.2

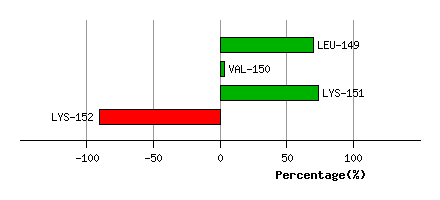
Graph shows rotational transition at bending residues and can be used
to identify hinge bending residues.
Probably only informative for interdomain rotations greater than 20 degrees
Residue
iResidue
i+1Distance of hinge axis to residue i in
(A) Distance of hinge axis to residue i in
(A) Change in
(deg) Change in
(deg) Angle of psi(i) axis to hinge axis
(deg) Angle of psi(i) axis to hinge axis
(deg) Percentage Progress
ILE-148
LEU-149
8.2
8.2
-2.9
2.9
104.8
106.5
11.3
LEU-149
VAL-150
6.9
6.9
0.5
-2.5
9.2
7.0
-66.7
VAL-150
LYS-151
7.6
7.8
0.5
3.9
80.0
78.0
71.1
LYS-151
LYS-152
9.2
9.3
-10.6
3.5
105.0
99.4
-164.6
Graph shows rotational transition at bending residues and can be used
to identify hinge bending residues.
Probably only informative for interdomain rotations greater than 20 degrees
Residue
iResidue
i+1Distance of hinge axis to residue i in
(A) Distance of hinge axis to residue i in
(A) Change in
(deg) Change in
(deg) Angle of psi(i) axis to hinge axis
(deg) Angle of psi(i) axis to hinge axis
(deg) Percentage Progress
ILE-172
TYR-173
4.9
4.9
4.9
-6.0
159.1
159.3
41.4
TYR-173
ALA-174
5.6
5.5
0.3
2.4
123.4
123.3
-156.4
ALA-174
THR-175
5.7
5.5
-1.6
-3.6
16.0
17.8
130.8

Graph shows rotational transition at bending residues and can be used
to identify hinge bending residues.
Probably only informative for interdomain rotations greater than 20 degrees
Residue
iResidue
i+1Distance of hinge axis to residue i in
(A) Distance of hinge axis to residue i in
(A) Change in
(deg) Change in
(deg) Angle of psi(i) axis to hinge axis
(deg) Angle of psi(i) axis to hinge axis
(deg) Percentage Progress
SER-180
VAL-181
9.9
9.7
-1.0
2.1
40.3
39.2
55.0
VAL-181
ASP-182
9.1
9.1
2.6
-2.2
133.7
129.9
-31.9
ASP-182
ILE-183
11.1
11.2
-1.9
5.9
108.9
112.2
-4.5
ILE-183
TYR-184
14.0
13.9
-5.4
1.4
83.4
78.8
14.4
TYR-184
PHE-185
13.8
13.8
-4.9
-0.1
27.5
27.7
68.8
PHE-185
ARG-186
14.4
14.4
3.1
-5.0
103.0
100.0
5.0
ARG-186
ARG-187
16.9
16.8
5.9
6.0
66.6
60.9
180.8
ARG-187
GLN-188
19.2
19.0
6.5
-13.2
105.1
111.2
70.5
GLN-188
VAL-189
20.1
20.5
-0.5
-6.6
21.4
19.0
259.2
VAL-189
GLU-190
22.7
22.7
7.0
4.7
130.3
132.7
-342.9
GLU-190
LEU-191
21.8
22.2
-6.3
4.5
70.0
74.0
51.5
LEU-191
SER-192
18.1
18.4
2.3
-5.3
127.1
121.0
33.1

Graph shows rotational transition at bending residues and can be used
to identify hinge bending residues.
Probably only informative for interdomain rotations greater than 20 degrees
Residue
iResidue
i+1Distance of hinge axis to residue i in
(A) Distance of hinge axis to residue i in
(A) Change in
(deg) Change in
(deg) Angle of psi(i) axis to hinge axis
(deg) Angle of psi(i) axis to hinge axis
(deg) Percentage Progress
ALA-209
ILE-210
3.4
3.4
-2.6
3.3
97.1
97.0
-35.3
ILE-210
GLN-211
4.6
4.6
0.0
1.7
134.8
136.0
34.1
GLN-211
ALA-212
7.5
7.4
-0.3
-5.4
154.7
154.8
-91.6

Graph shows rotational transition at bending residues and can be used
to identify hinge bending residues.
Probably only informative for interdomain rotations greater than 20 degrees
Residue
iResidue
i+1Distance of hinge axis to residue i in
(A) Distance of hinge axis to residue i in
(A) Change in
(deg) Change in
(deg) Angle of psi(i) axis to hinge axis
(deg) Angle of psi(i) axis to hinge axis
(deg) Percentage Progress
GLU-231
ALA-232
9.3
9.4
5.2
-8.5
127.8
129.0
1.2
ALA-232
SER-233
11.4
11.5
0.1
0.8
69.7
73.0
-70.6
SER-233
GLN-234
14.3
14.4
-6.1
12.9
84.0
84.2
25.6

Graph shows rotational transition at bending residues and can be used
to identify hinge bending residues.
Probably only informative for interdomain rotations greater than 20 degrees
Residue
iResidue
i+1Distance of hinge axis to residue i in
(A) Distance of hinge axis to residue i in
(A) Change in
(deg) Change in
(deg) Angle of psi(i) axis to hinge axis
(deg) Angle of psi(i) axis to hinge axis
(deg) Percentage Progress
CYS-236
ASP-237
15.8
15.6
4.5
3.5
28.4
23.1
183.8
ASP-237
LEU-238
13.6
13.6
-1.1
2.4
79.7
78.7
7.6
LEU-238
VAL-239
11.0
10.9
-0.3
-1.3
60.8
60.7
69.9
VAL-239
THR-240
11.9
11.9
-2.0
5.5
76.0
75.1
-5.2
THR-240
THR-241
11.1
11.1
-8.9
-87.8
109.7
111.7
-618.7
THR-241
GLY-242
13.2
13.1
-173.4
-26.5
52.1
62.3
-2350.7
GLY-242
GLU-243
14.9
15.3
79.1
125.1
129.6
172.8
3846.4
GLU-243
LEU-244
15.6
15.1
66.8
-10.8
106.9
105.8
-850.6
LEU-244
PHE-245
13.7
13.7
-8.7
5.8
109.7
108.9
-28.9
PHE-245
PHE-246
14.9
14.9
3.4
-6.3
131.1
132.1
-25.7

Graph shows rotational transition at bending residues and can be used
to identify hinge bending residues.
Probably only informative for interdomain rotations greater than 20 degrees