Pectate Lyase
(All numbering and residues are taken from first PDB file)
![]()
![]()
Bending Residue Dihedral Analysis
Residue
iResidue
i+1Distance of hinge axis to residue i in
(A) Distance of hinge axis to residue i in
(A) Change in
(deg) Change in
(deg) Angle of psi(i) axis to hinge axis
(deg) Angle of psi(i) axis to hinge axis
(deg) Percentage Progress
SER-185
LYS-186
7.7
7.7
3.9
-7.9
88.2
86.3
-1.9
LYS-186
PHE-187
4.2
4.3
-8.6
3.6
41.1
42.0
40.0
PHE-187
GLU-188
2.9
2.7
3.5
-0.8
75.0
71.8
43.3
GLU-188
GLN-189
4.6
4.2
9.3
-3.7
148.9
148.8
-28.7

Graph shows rotational transition at bending residues and can be used
to identify hinge bending residues.
Probably only informative for interdomain rotations greater than 20 degrees
Residue
iResidue
i+1Distance of hinge axis to residue i in
(A) Distance of hinge axis to residue i in
(A) Change in
(deg) Change in
(deg) Angle of psi(i) axis to hinge axis
(deg) Angle of psi(i) axis to hinge axis
(deg) Percentage Progress
SER-200
PHE-201
12.3
12.0
46.2
-9.0
14.6
11.2
222.5
PHE-201
LEU-202
12.7
12.5
0.7
4.9
78.4
73.5
-7.7
LEU-202
ASN-203
9.5
9.3
-17.5
-11.9
118.9
114.7
-112.1

Graph shows rotational transition at bending residues and can be used
to identify hinge bending residues.
Probably only informative for interdomain rotations greater than 20 degrees
Residue
iResidue
i+1Distance of hinge axis to residue i in
(A) Distance of hinge axis to residue i in
(A) Change in
(deg) Change in
(deg) Angle of psi(i) axis to hinge axis
(deg) Angle of psi(i) axis to hinge axis
(deg) Percentage Progress
ALA-232
ASP-233
1.8
1.6
-1.6
-1.0
98.3
97.1
20.4
ASP-233
GLN-234
1.8
1.9
9.4
-5.4
80.7
77.5
21.1
GLN-234
TYR-235
4.4
4.2
2.0
-6.2
146.0
144.0
14.8
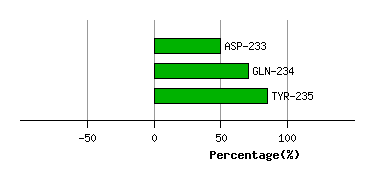
Graph shows rotational transition at bending residues and can be used
to identify hinge bending residues.
Probably only informative for interdomain rotations greater than 20 degrees
Residue
iResidue
i+1Distance of hinge axis to residue i in
(A) Distance of hinge axis to residue i in
(A) Change in
(deg) Change in
(deg) Angle of psi(i) axis to hinge axis
(deg) Angle of psi(i) axis to hinge axis
(deg) Percentage Progress
SER-301
GLU-302
4.5
4.1
10.6
5.4
133.7
126.0
-82.8
GLU-302
ASN-303
7.0
7.1
0.4
-13.6
142.8
143.8
113.8
ASN-303
ALA-304
4.7
4.9
-4.8
-1.1
105.7
106.2
61.4
ALA-304
LEU-305
2.4
2.0
0.2
6.1
77.3
68.9
-17.4
LEU-305
MET-306
5.9
5.1
-6.8
10.9
35.1
44.9
8.5
MET-306
GLN-307
7.5
7.3
-7.4
7.9
56.2
53.9
-10.8
GLN-307
LEU-308
5.4
5.3
-0.3
4.3
114.6
115.4
5.7

Graph shows rotational transition at bending residues and can be used
to identify hinge bending residues.
Probably only informative for interdomain rotations greater than 20 degrees
Residue
iResidue
i+1Distance of hinge axis to residue i in
(A) Distance of hinge axis to residue i in
(A) Change in
(deg) Change in
(deg) Angle of psi(i) axis to hinge axis
(deg) Angle of psi(i) axis to hinge axis
(deg) Percentage Progress
LEU-310
GLY-311
10.1
10.1
-4.7
9.4
102.7
104.9
9.9
GLY-311
LYS-312
9.6
9.6
-4.7
6.0
74.1
72.2
4.0
LYS-312
ASP-313
12.8
12.7
-17.7
-5.4
124.0
119.3
-69.8
ASP-313
LEU-314
14.5
14.7
10.0
2.4
28.2
13.5
68.8
LEU-314
GLY-315
13.8
14.0
-1.9
-7.0
92.3
99.7
33.5
GLY-315
PRO-316
15.9
16.1
1.4
0.7
63.3
46.1
-13.3
PRO-316
GLN-317
16.0
16.6
21.3
-9.1
64.1
57.9
18.3
GLN-317
GLY-318
12.9
13.5
-15.1
-10.9
53.9
58.2
56.8
GLY-318
GLN-319
10.9
11.1
9.0
6.3
122.0
113.3
-74.1
GLN-319
ASP-320
11.6
12.0
-8.6
-5.0
95.7
95.4
28.9

Graph shows rotational transition at bending residues and can be used
to identify hinge bending residues.
Probably only informative for interdomain rotations greater than 20 degrees
Residue
iResidue
i+1Distance of hinge axis to residue i in
(A) Distance of hinge axis to residue i in
(A) Change in
(deg) Change in
(deg) Angle of psi(i) axis to hinge axis
(deg) Angle of psi(i) axis to hinge axis
(deg) Percentage Progress
PRO-395
LEU-396
12.8
12.9
3.1
-8.1
94.5
95.1
9.3
LEU-396
LEU-397
11.2
10.9
10.6
-12.4
88.9
84.5
-13.8
LEU-397
TRP-398
7.9
7.7
7.4
1.7
23.3
19.8
61.5
TRP-398
LYS-399
8.4
8.5
-10.9
15.3
127.9
121.1
-22.2
LYS-399
VAL-400
8.6
8.6
-2.1
-7.6
89.2
93.1
-20.3
VAL-400
ALA-401
5.7
5.3
-1.1
5.1
117.1
123.0
28.4
ALA-401
ARG-402
3.4
3.6
2.2
-3.4
5.2
11.7
4.9
ARG-402
GLY-403
4.9
5.1
-8.3
8.1
112.9
111.5
-21.5
GLY-403
ILE-404
5.1
5.2
-1.7
-3.8
92.2
95.9
-27.9
ILE-404
ALA-405
2.6
2.5
4.1
-1.1
42.7
40.1
39.6

Graph shows rotational transition at bending residues and can be used
to identify hinge bending residues.
Probably only informative for interdomain rotations greater than 20 degrees