Troponin C
(All numbering and residues are taken from first PDB file)
![]()
![]()
Bending Residue Dihedral Analysis
Residue
iResidue
i+1Distance of hinge axis to residue i in
(A) Distance of hinge axis to residue i in
(A) Change in
(deg) Change in
(deg) Angle of psi(i) axis to hinge axis
(deg) Angle of psi(i) axis to hinge axis
(deg) Percentage Progress
PHE-99
ARG-100
3.7
4.0
-8.9
11.3
49.1
46.2
-59.6
ARG-100
ILE-101
4.4
4.8
-6.3
-5.2
22.2
24.8
110.1
ILE-101
PHE-102
4.3
4.6
3.1
-6.4
97.2
93.6
-12.1
PHE-102
ASP-103
2.6
3.1
-2.7
8.4
88.4
88.9
-18.6
ASP-103
ARG-104
1.2
0.8
10.4
-3.5
139.4
143.7
-51.7

Graph shows rotational transition at bending residues and can be used
to identify hinge bending residues.
Probably only informative for interdomain rotations greater than 20 degrees
Residue
iResidue
i+1Distance of hinge axis to residue i in
(A) Distance of hinge axis to residue i in
(A) Change in
(deg) Change in
(deg) Angle of psi(i) axis to hinge axis
(deg) Angle of psi(i) axis to hinge axis
(deg) Percentage Progress
ASN-105
ALA-106
6.0
5.4
2.0
24.4
34.9
39.0
207.1
ALA-106
ASP-107
5.7
5.7
-28.3
11.7
123.7
125.6
-148.5
ASP-107
GLY-108
7.9
7.4
-4.5
14.1
155.1
161.4
112.9
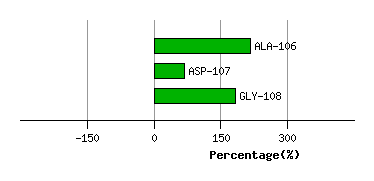
Graph shows rotational transition at bending residues and can be used
to identify hinge bending residues.
Probably only informative for interdomain rotations greater than 20 degrees
Residue
iResidue
i+1Distance of hinge axis to residue i in
(A) Distance of hinge axis to residue i in
(A) Change in
(deg) Change in
(deg) Angle of psi(i) axis to hinge axis
(deg) Angle of psi(i) axis to hinge axis
(deg) Percentage Progress
GLU-150
PHE-151
5.6
5.5
-1.4
1.2
130.4
125.7
-13.3
PHE-151
LEU-152
5.4
5.4
3.0
-2.4
117.1
121.9
57.0
LEU-152
LYS-153
6.4
6.1
-4.4
1.5
61.8
60.3
-1.3
LYS-153
MET-154
8.4
7.9
-6.1
1.1
126.7
125.5
-77.5
MET-154
MET-155
10.2
10.1
12.5
-7.4
69.4
69.1
74.6
MET-155
GLU-156
10.7
10.7
47.9
11.5
130.2
134.7
-343.6

Graph shows rotational transition at bending residues and can be used
to identify hinge bending residues.
Probably only informative for interdomain rotations greater than 20 degrees