Udp-Glucose 4-Epimerase
(All numbering and residues are taken from first PDB file)
![]()
![]()
Bending Residue Dihedral Analysis
Residue
iResidue
i+1Distance of hinge axis to residue i in
(A) Distance of hinge axis to residue i in
(A) Change in
(deg) Change in
(deg) Angle of psi(i) axis to hinge axis
(deg) Angle of psi(i) axis to hinge axis
(deg) Percentage Progress
TYR-141
LEU-142
9.6
9.1
-8.4
7.9
130.5
132.5
8.6
LEU-142
PRO-143
7.2
7.0
-5.7
-1.5
75.6
78.5
6.3
PRO-143
LEU-144
4.6
4.3
-9.0
15.0
49.1
46.7
-40.4
LEU-144
ASP-145
3.7
3.7
13.9
-22.0
113.6
114.2
23.1
ASP-145
GLU-146
1.6
1.6
8.0
-0.1
113.2
121.4
-55.5
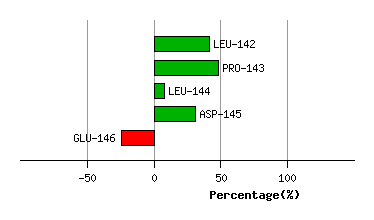
Graph shows rotational transition at bending residues and can be used
to identify hinge bending residues.
Probably only informative for interdomain rotations greater than 20 degrees
Residue
iResidue
i+1Distance of hinge axis to residue i in
(A) Distance of hinge axis to residue i in
(A) Change in
(deg) Change in
(deg) Angle of psi(i) axis to hinge axis
(deg) Angle of psi(i) axis to hinge axis
(deg) Percentage Progress
GLU-199
ASP-200
14.9
15.5
-2.3
56.6
141.8
143.0
367.0
ASP-200
PRO-201
17.6
17.8
78.9
12.4
102.1
93.4
-207.3
PRO-201
GLN-202
18.1
17.1
-24.1
8.3
134.0
51.2
-68.3
GLN-202
GLY-203
21.4
18.6
22.2
-138.9
83.2
75.2
-261.3
GLY-203
ILE-204
21.4
21.2
108.8
-57.7
96.0
110.6
-78.2
ILE-204
PRO-205
19.2
19.6
-32.5
11.1
26.9
62.3
120.2
PRO-205
ASN-206
16.5
15.9
9.6
-1.1
127.0
150.9
-42.6
ASN-206
ASN-207
16.8
14.4
9.6
-48.7
110.9
86.4
25.3
ASN-207
LEU-208
13.1
11.3
21.8
-13.8
44.4
20.4
37.2
LEU-208
MET-209
10.3
9.8
28.3
3.9
45.1
42.9
284.1
MET-209
PRO-210
8.0
7.5
4.4
2.6
37.4
37.2
-71.6

Graph shows rotational transition at bending residues and can be used
to identify hinge bending residues.
Probably only informative for interdomain rotations greater than 20 degrees
Residue
iResidue
i+1Distance of hinge axis to residue i in
(A) Distance of hinge axis to residue i in
(A) Change in
(deg) Change in
(deg) Angle of psi(i) axis to hinge axis
(deg) Angle of psi(i) axis to hinge axis
(deg) Percentage Progress
VAL-215
ALA-216
9.7
9.5
14.9
-11.3
125.0
126.1
4.2
ALA-216
ILE-217
6.2
6.0
-1.7
-7.7
45.3
37.8
-25.7
ILE-217
GLY-218
8.4
8.0
14.1
-17.9
137.3
127.1
59.8
GLY-218
ARG-219
10.1
10.1
-13.9
15.4
94.5
100.6
1.5

Graph shows rotational transition at bending residues and can be used
to identify hinge bending residues.
Probably only informative for interdomain rotations greater than 20 degrees
Residue
iResidue
i+1Distance of hinge axis to residue i in
(A) Distance of hinge axis to residue i in
(A) Change in
(deg) Change in
(deg) Angle of psi(i) axis to hinge axis
(deg) Angle of psi(i) axis to hinge axis
(deg) Percentage Progress
VAL-238
ARG-239
8.3
8.4
-13.4
20.4
118.2
115.2
35.5
ARG-239
ASP-240
5.5
6.2
7.7
-13.2
90.1
84.5
-9.8
ASP-240
TYR-241
2.2
3.5
17.5
-41.2
123.6
124.2
139.4
TYR-241
ILE-242
3.0
3.8
12.1
-4.2
79.4
78.4
4.4

Graph shows rotational transition at bending residues and can be used
to identify hinge bending residues.
Probably only informative for interdomain rotations greater than 20 degrees
Residue
iResidue
i+1Distance of hinge axis to residue i in
(A) Distance of hinge axis to residue i in
(A) Change in
(deg) Change in
(deg) Angle of psi(i) axis to hinge axis
(deg) Angle of psi(i) axis to hinge axis
(deg) Percentage Progress
GLY-274
TYR-275
4.1
3.7
20.6
9.9
26.1
22.7
225.1
TYR-275
SER-276
5.0
4.4
-6.9
5.1
102.9
103.5
5.6
SER-276
VAL-277
8.0
7.8
-11.6
-3.4
145.4
148.9
-96.4

Graph shows rotational transition at bending residues and can be used
to identify hinge bending residues.
Probably only informative for interdomain rotations greater than 20 degrees
Residue
iResidue
i+1Distance of hinge axis to residue i in
(A) Distance of hinge axis to residue i in
(A) Change in
(deg) Change in
(deg) Angle of psi(i) axis to hinge axis
(deg) Angle of psi(i) axis to hinge axis
(deg) Percentage Progress
LYS-286
ALA-287
3.9
4.5
-6.4
0.8
82.2
76.7
-18.7
ALA-287
SER-288
3.4
3.6
3.2
-4.0
151.0
147.7
0.3
SER-288
GLY-289
2.3
1.9
-5.5
4.6
29.8
29.6
29.4
GLY-289
LYS-290
2.2
2.4
-21.3
34.5
59.5
64.7
-14.9
LYS-290
LYS-291
2.1
2.2
7.9
-12.5
57.2
58.3
-5.9

Graph shows rotational transition at bending residues and can be used
to identify hinge bending residues.
Probably only informative for interdomain rotations greater than 20 degrees
Residue
iResidue
i+1Distance of hinge axis to residue i in
(A) Distance of hinge axis to residue i in
(A) Change in
(deg) Change in
(deg) Angle of psi(i) axis to hinge axis
(deg) Angle of psi(i) axis to hinge axis
(deg) Percentage Progress
ALA-309
ASN-310
1.0
1.5
-6.4
11.7
114.3
100.2
120.1
ASN-310
PRO-311
1.7
1.7
12.3
-12.7
88.4
82.2
18.6
PRO-311
SER-312
4.8
5.0
7.7
12.6
53.6
59.0
119.4
SER-312
LEU-313
6.9
7.0
-14.5
4.3
125.7
125.4
-78.1

Graph shows rotational transition at bending residues and can be used
to identify hinge bending residues.
Probably only informative for interdomain rotations greater than 20 degrees