Udp-Glucose 4-Epimerase
(All numbering and residues are taken from first PDB file)
![]()
![]()
Bending Residue Dihedral Analysis
Residue
iResidue
i+1Distance of hinge axis to residue i in
(A) Distance of hinge axis to residue i in
(A) Change in
(deg) Change in
(deg) Angle of psi(i) axis to hinge axis
(deg) Angle of psi(i) axis to hinge axis
(deg) Percentage Progress
LEU-208
MET-209
11.4
11.1
25.8
1.7
40.0
36.1
306.4
MET-209
PRO-210
8.9
8.6
3.2
7.7
35.3
33.4
-68.0
PRO-210
TYR-211
11.6
11.3
-4.1
-0.3
120.3
122.6
14.4

Graph shows rotational transition at bending residues and can be used
to identify hinge bending residues.
Probably only informative for interdomain rotations greater than 20 degrees
Residue
iResidue
i+1Distance of hinge axis to residue i in
(A) Distance of hinge axis to residue i in
(A) Change in
(deg) Change in
(deg) Angle of psi(i) axis to hinge axis
(deg) Angle of psi(i) axis to hinge axis
(deg) Percentage Progress
GLY-237
VAL-238
12.0
12.2
-2.4
10.7
81.7
84.0
-3.7
VAL-238
ARG-239
8.4
8.6
-16.1
19.1
110.2
107.8
30.6
ARG-239
ASP-240
6.0
6.8
4.5
-11.9
95.9
91.7
-10.9
ASP-240
TYR-241
3.1
4.4
24.3
-48.0
132.5
132.4
165.9
TYR-241
ILE-242
3.9
4.6
13.9
-6.7
83.7
85.2
-6.0

Graph shows rotational transition at bending residues and can be used
to identify hinge bending residues.
Probably only informative for interdomain rotations greater than 20 degrees
Residue
iResidue
i+1Distance of hinge axis to residue i in
(A) Distance of hinge axis to residue i in
(A) Change in
(deg) Change in
(deg) Angle of psi(i) axis to hinge axis
(deg) Angle of psi(i) axis to hinge axis
(deg) Percentage Progress
THR-273
GLY-274
2.6
2.9
1.5
15.4
69.0
64.8
20.7
GLY-274
TYR-275
3.5
3.2
11.2
14.4
33.6
30.1
208.1
TYR-275
SER-276
5.1
4.6
-9.1
5.2
98.0
96.8
-17.0

Graph shows rotational transition at bending residues and can be used
to identify hinge bending residues.
Probably only informative for interdomain rotations greater than 20 degrees
Residue
iResidue
i+1Distance of hinge axis to residue i in
(A) Distance of hinge axis to residue i in
(A) Change in
(deg) Change in
(deg) Angle of psi(i) axis to hinge axis
(deg) Angle of psi(i) axis to hinge axis
(deg) Percentage Progress
CYS-307
TYR-308
7.2
7.5
-19.5
8.6
70.1
71.7
55.4
TYR-308
ALA-309
3.5
3.9
4.0
-10.2
40.3
36.6
-60.5
ALA-309
ASN-310
2.4
2.7
0.9
0.5
65.2
82.0
99.8
ASN-310
PRO-311
2.4
2.6
10.5
-17.8
98.4
91.2
49.1
PRO-311
SER-312
5.9
6.3
12.1
2.5
53.6
63.7
50.2
SER-312
LEU-313
7.8
8.0
0.5
6.5
68.0
63.3
-6.0
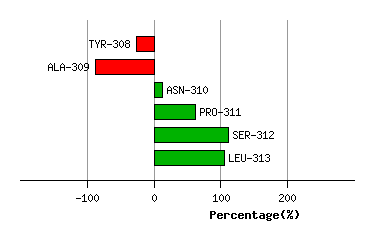
Graph shows rotational transition at bending residues and can be used
to identify hinge bending residues.
Probably only informative for interdomain rotations greater than 20 degrees