Topoisomerase I
(All numbering and residues are taken from first PDB file)
![]()
![]()
Bending Residue Dihedral Analysis
Residue
iResidue
i+1Distance of hinge axis to residue i in
(A) Distance of hinge axis to residue i in
(A) Change in
(deg) Change in
(deg) Angle of psi(i) axis to hinge axis
(deg) Angle of psi(i) axis to hinge axis
(deg) Percentage Progress
LEU-429
ASN-430
7.7
7.5
0.4
-20.5
125.3
127.2
393.6
ASN-430
PRO-431
8.2
8.2
3.7
9.6
132.2
124.0
-275.8
PRO-431
SER-432
7.1
7.1
1.4
-3.6
63.2
64.5
-7.7
SER-432
SER-433
6.8
6.8
-12.4
-2.3
117.6
115.9
-181.3
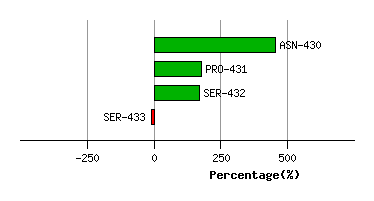
Graph shows rotational transition at bending residues and can be used
to identify hinge bending residues.
Probably only informative for interdomain rotations greater than 20 degrees
Residue
iResidue
i+1Distance of hinge axis to residue i in
(A) Distance of hinge axis to residue i in
(A) Change in
(deg) Change in
(deg) Angle of psi(i) axis to hinge axis
(deg) Angle of psi(i) axis to hinge axis
(deg) Percentage Progress
LYS-436
GLY-437
2.3
2.3
11.8
-14.1
115.6
116.1
31.7
GLY-437
GLU-438
2.9
2.9
-4.2
0.2
60.6
61.7
57.0
GLU-438
LYS-439
3.0
3.3
1.6
-4.8
155.3
152.7
38.3

Graph shows rotational transition at bending residues and can be used
to identify hinge bending residues.
Probably only informative for interdomain rotations greater than 20 degrees
Residue
iResidue
i+1Distance of hinge axis to residue i in
(A) Distance of hinge axis to residue i in
(A) Change in
(deg) Change in
(deg) Angle of psi(i) axis to hinge axis
(deg) Angle of psi(i) axis to hinge axis
(deg) Percentage Progress
ASP-440
TRP-441
2.3
2.3
0.1
-2.4
73.8
69.9
-62.3
TRP-441
GLN-442
5.1
5.2
15.1
-13.3
47.1
48.8
25.2
GLN-442
LYS-443
4.9
4.9
5.3
-4.4
26.9
25.5
58.1

Graph shows rotational transition at bending residues and can be used
to identify hinge bending residues.
Probably only informative for interdomain rotations greater than 20 degrees
Residue
iResidue
i+1Distance of hinge axis to residue i in
(A) Distance of hinge axis to residue i in
(A) Change in
(deg) Change in
(deg) Angle of psi(i) axis to hinge axis
(deg) Angle of psi(i) axis to hinge axis
(deg) Percentage Progress
ALA-447
ARG-448
5.2
5.5
1.9
-4.6
108.8
107.6
43.6
ARG-448
ARG-449
9.0
9.3
-2.6
3.6
57.3
60.2
16.2
ARG-449
LEU-450
9.7
10.2
-5.8
1.9
22.3
19.3
83.9

Graph shows rotational transition at bending residues and can be used
to identify hinge bending residues.
Probably only informative for interdomain rotations greater than 20 degrees
Residue
iResidue
i+1Distance of hinge axis to residue i in
(A) Distance of hinge axis to residue i in
(A) Change in
(deg) Change in
(deg) Angle of psi(i) axis to hinge axis
(deg) Angle of psi(i) axis to hinge axis
(deg) Percentage Progress
LYS-471
VAL-472
14.2
14.4
24.7
-19.3
106.7
105.2
-44.7
VAL-472
ARG-473
12.0
12.0
-0.7
9.5
104.3
107.9
115.2
ARG-473
GLN-474
9.4
9.3
-8.2
2.2
57.3
54.1
-28.6

Graph shows rotational transition at bending residues and can be used
to identify hinge bending residues.
Probably only informative for interdomain rotations greater than 20 degrees
Residue
iResidue
i+1Distance of hinge axis to residue i in
(A) Distance of hinge axis to residue i in
(A) Change in
(deg) Change in
(deg) Angle of psi(i) axis to hinge axis
(deg) Angle of psi(i) axis to hinge axis
(deg) Percentage Progress
ARG-475
ALA-476
9.2
9.2
0.5
-11.0
99.4
94.9
47.4
ALA-476
VAL-477
6.3
6.1
2.5
-4.2
99.2
96.6
35.5
VAL-477
ALA-478
5.3
5.2
0.7
5.8
32.1
29.5
87.9

Graph shows rotational transition at bending residues and can be used
to identify hinge bending residues.
Probably only informative for interdomain rotations greater than 20 degrees
Residue
iResidue
i+1Distance of hinge axis to residue i in
(A) Distance of hinge axis to residue i in
(A) Change in
(deg) Change in
(deg) Angle of psi(i) axis to hinge axis
(deg) Angle of psi(i) axis to hinge axis
(deg) Percentage Progress
ASP-483
LYS-484
2.4
2.6
4.8
-4.5
72.2
71.3
-1.8
LYS-484
LEU-485
5.3
5.6
1.3
2.2
110.5
111.7
-33.8
LEU-485
ALA-486
7.9
8.1
7.4
-10.1
163.7
163.9
42.2

Graph shows rotational transition at bending residues and can be used
to identify hinge bending residues.
Probably only informative for interdomain rotations greater than 20 degrees
Residue
iResidue
i+1Distance of hinge axis to residue i in
(A) Distance of hinge axis to residue i in
(A) Change in
(deg) Change in
(deg) Angle of psi(i) axis to hinge axis
(deg) Angle of psi(i) axis to hinge axis
(deg) Percentage Progress
LYS-545
ARG-546
3.2
3.3
12.9
-4.9
77.9
79.2
60.7
ARG-546
VAL-547
2.0
1.8
-0.4
0.9
136.6
134.0
55.7
VAL-547
PHE-548
3.7
3.8
9.4
-7.9
113.1
114.9
12.6
PHE-548
LYS-549
6.5
6.5
7.3
-5.4
57.5
55.9
0.7
PHE-548
LYS-549
6.5
6.5
7.3
-5.4
57.5
55.9
0.7

Graph shows rotational transition at bending residues and can be used
to identify hinge bending residues.
Probably only informative for interdomain rotations greater than 20 degrees
Residue
iResidue
i+1Distance of hinge axis to residue i in
(A) Distance of hinge axis to residue i in
(A) Change in
(deg) Change in
(deg) Angle of psi(i) axis to hinge axis
(deg) Angle of psi(i) axis to hinge axis
(deg) Percentage Progress
PHE-548
LYS-549
6.5
6.5
7.3
-5.4
57.5
55.9
0.7
PHE-548
LYS-549
6.5
6.5
7.3
-5.4
57.5
55.9
0.7
LYS-549
ASN-550
6.7
6.5
11.7
-16.3
124.0
124.2
67.7
ASN-550
LEU-551
7.7
7.7
-4.3
3.1
67.5
68.5
16.7

Graph shows rotational transition at bending residues and can be used
to identify hinge bending residues.
Probably only informative for interdomain rotations greater than 20 degrees
Residue
iResidue
i+1Distance of hinge axis to residue i in
(A) Distance of hinge axis to residue i in
(A) Change in
(deg) Change in
(deg) Angle of psi(i) axis to hinge axis
(deg) Angle of psi(i) axis to hinge axis
(deg) Percentage Progress
LEU-577
GLN-578
8.9
8.8
6.8
-4.1
44.0
43.9
28.1
GLN-578
ASP-579
11.2
11.3
12.0
-8.1
112.4
111.9
42.1
ASP-579
LEU-580
13.8
13.7
-15.7
20.1
72.0
78.9
29.6
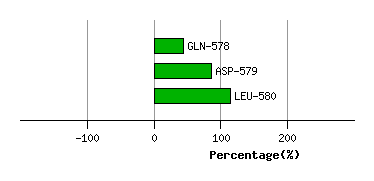
Graph shows rotational transition at bending residues and can be used
to identify hinge bending residues.
Probably only informative for interdomain rotations greater than 20 degrees
Residue
iResidue
i+1Distance of hinge axis to residue i in
(A) Distance of hinge axis to residue i in
(A) Change in
(deg) Change in
(deg) Angle of psi(i) axis to hinge axis
(deg) Angle of psi(i) axis to hinge axis
(deg) Percentage Progress
MET-581
GLU-582
11.1
10.9
12.8
-5.7
142.4
143.8
-88.8
GLU-582
GLY-583
11.6
11.8
1.4
-12.7
117.5
118.6
110.5
GLY-583
LEU-584
8.4
8.8
8.4
2.4
50.3
55.2
103.2

Graph shows rotational transition at bending residues and can be used
to identify hinge bending residues.
Probably only informative for interdomain rotations greater than 20 degrees
Residue
iResidue
i+1Distance of hinge axis to residue i in
(A) Distance of hinge axis to residue i in
(A) Change in
(deg) Change in
(deg) Angle of psi(i) axis to hinge axis
(deg) Angle of psi(i) axis to hinge axis
(deg) Percentage Progress
VAL-588
PHE-589
0.2
0.2
-3.7
1.9
45.5
46.6
40.5
PHE-589
ARG-590
1.7
1.6
-5.6
6.0
103.0
102.0
44.0
ARG-590
THR-591
4.9
4.8
-1.1
-1.5
132.9
132.4
-72.0

Graph shows rotational transition at bending residues and can be used
to identify hinge bending residues.
Probably only informative for interdomain rotations greater than 20 degrees
Residue
iResidue
i+1Distance of hinge axis to residue i in
(A) Distance of hinge axis to residue i in
(A) Change in
(deg) Change in
(deg) Angle of psi(i) axis to hinge axis
(deg) Angle of psi(i) axis to hinge axis
(deg) Percentage Progress
ARG-624
ALA-625
19.9
19.5
23.4
-7.3
47.3
34.6
195.2
ALA-625
VAL-626
17.6
17.5
-8.8
-6.8
69.2
79.0
-16.6
LYS-720
LEU-721
13.6
13.9
164.6
-35.0
129.6
136.2
-1951.9
LEU-721
ASN-722
12.0
11.6
-28.0
-11.3
94.2
106.7
-114.6
LEU-724
ASP-725
9.9
10.3
1.3
7.8
138.9
140.0
-168.3
ASP-725
PRO-726
9.6
9.8
0.7
-0.3
118.3
121.1
10.4
PRO-726
ARG-727
12.0
12.1
0.5
-5.3
96.5
93.4
-21.9
ARG-727
ILE-728
13.6
13.8
0.1
-0.4
47.2
44.7
-23.1

Graph shows rotational transition at bending residues and can be used
to identify hinge bending residues.
Probably only informative for interdomain rotations greater than 20 degrees