Probable Aspartokinase
(All numbering and residues are taken from first PDB file)
![]()
![]()
Bending Residue Dihedral Analysis
Residue
iResidue
i+1Distance of hinge axis to residue i in
(A) Distance of hinge axis to residue i in
(A) Change in
(deg) Change in
(deg) Angle of psi(i) axis to hinge axis
(deg) Angle of psi(i) axis to hinge axis
(deg) Percentage Progress
ILE-194
GLY-195
19.7
19.6
13.4
-9.9
91.8
87.2
28.3
GLY-195
THR-196
21.0
20.9
-1.9
9.0
76.5
74.3
27.5
THR-196
THR-197
24.4
24.1
-14.5
10.0
135.0
144.5
-47.8
THR-197
GLU-198
27.3
26.8
8.9
-15.1
124.6
110.3
103.8
GLU-198
GLU-199
29.2
28.6
22.7
-17.6
134.8
136.1
-90.6
GLU-199
GLY-200
32.0
31.3
-29.9
23.7
50.5
36.3
55.1
GLY-200
TYR-201
29.5
29.0
9.3
-8.7
77.0
90.3
-90.6
TYR-201
ILE-202
29.4
29.1
-0.6
19.4
99.6
98.8
54.5
ILE-202
THR-203
26.4
26.1
1.9
2.5
27.5
24.0
44.1
THR-203
THR-204
24.8
24.5
3.5
-9.6
88.6
88.0
-112.4
THR-204
LEU-205
22.3
22.1
-4.9
6.0
148.9
149.2
17.7
LEU-205
GLY-206
19.4
19.2
-1.8
20.5
129.9
128.9
171.7
GLY-206
ARG-207
20.0
19.7
-34.7
7.4
80.5
60.8
92.1
ARG-207
GLY-208
18.0
19.1
2.4
2.3
87.7
82.4
-6.7
GLY-208
GLY-209
14.3
15.5
-0.8
-8.0
55.1
79.5
39.8
GLY-209
SER-210
15.4
15.3
25.3
1.5
138.2
134.2
-345.9
SER-210
ASP-211
13.1
13.1
6.1
5.5
72.1
67.7
102.0
ASP-211
TYR-212
10.0
10.1
-12.0
5.6
111.5
111.3
-73.9
TYR-212
SER-213
11.6
11.5
0.5
4.4
135.9
135.6
-20.1
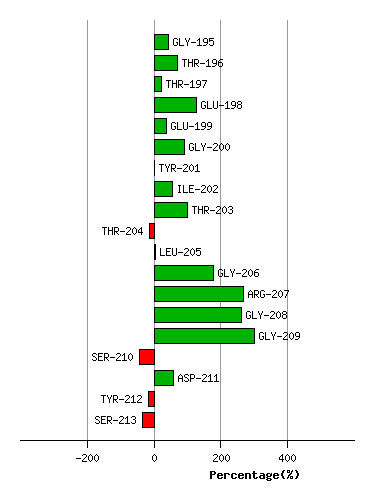
Graph shows rotational transition at bending residues and can be used
to identify hinge bending residues.
Probably only informative for interdomain rotations greater than 20 degrees
Residue
iResidue
i+1Distance of hinge axis to residue i in
(A) Distance of hinge axis to residue i in
(A) Change in
(deg) Change in
(deg) Angle of psi(i) axis to hinge axis
(deg) Angle of psi(i) axis to hinge axis
(deg) Percentage Progress
SER-233
GLY-234
13.0
13.0
20.0
-8.1
38.3
33.9
142.3
GLY-234
VAL-235
10.3
10.1
-2.3
-3.4
146.2
142.8
-83.4
VAL-235
TYR-236
10.8
10.4
1.3
-5.2
72.0
65.6
3.8
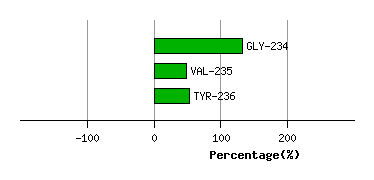
Graph shows rotational transition at bending residues and can be used
to identify hinge bending residues.
Probably only informative for interdomain rotations greater than 20 degrees
Residue
iResidue
i+1Distance of hinge axis to residue i in
(A) Distance of hinge axis to residue i in
(A) Change in
(deg) Change in
(deg) Angle of psi(i) axis to hinge axis
(deg) Angle of psi(i) axis to hinge axis
(deg) Percentage Progress
ILE-249
PRO-250
12.0
11.7
-6.6
5.6
130.2
128.5
-44.0
PRO-250
LYS-251
11.5
11.1
-7.8
11.8
77.8
77.6
-4.8
LYS-251
LEU-252
9.0
8.5
14.2
-19.3
145.5
139.8
50.4

Graph shows rotational transition at bending residues and can be used
to identify hinge bending residues.
Probably only informative for interdomain rotations greater than 20 degrees
Residue
iResidue
i+1Distance of hinge axis to residue i in
(A) Distance of hinge axis to residue i in
(A) Change in
(deg) Change in
(deg) Angle of psi(i) axis to hinge axis
(deg) Angle of psi(i) axis to hinge axis
(deg) Percentage Progress
GLU-259
LEU-260
5.8
6.6
-5.2
15.2
70.2
69.7
-44.7
LEU-260
ALA-261
8.3
8.8
-4.9
5.9
60.2
68.0
44.7
ALA-261
TYR-262
9.1
10.0
51.5
-41.3
58.6
44.6
121.0

Graph shows rotational transition at bending residues and can be used
to identify hinge bending residues.
Probably only informative for interdomain rotations greater than 20 degrees
Residue
iResidue
i+1Distance of hinge axis to residue i in
(A) Distance of hinge axis to residue i in
(A) Change in
(deg) Change in
(deg) Angle of psi(i) axis to hinge axis
(deg) Angle of psi(i) axis to hinge axis
(deg) Percentage Progress
HIS-269
PRO-270
9.5
10.6
12.8
-4.3
109.0
101.9
-86.0
PRO-270
ARG-271
8.5
8.4
13.0
9.3
55.6
64.3
207.0
ARG-271
THR-272
10.7
11.0
-2.2
3.0
141.1
147.3
-79.9
THR-272
ILE-273
8.2
8.8
1.1
1.2
109.5
101.6
76.7
ILE-273
GLU-274
5.3
5.7
5.3
9.8
109.9
104.8
-26.2
GLU-274
PRO-275
7.8
8.4
-3.1
-0.7
124.1
127.1
-27.1
PRO-275
ALA-276
9.6
9.8
0.2
-4.2
70.5
75.2
11.4
ALA-276
MET-277
6.7
6.7
-6.7
8.7
41.3
40.6
-65.9
MET-277
GLU-278
6.5
6.6
5.4
-12.5
100.3
97.2
86.6

Graph shows rotational transition at bending residues and can be used
to identify hinge bending residues.
Probably only informative for interdomain rotations greater than 20 degrees
Residue
iResidue
i+1Distance of hinge axis to residue i in
(A) Distance of hinge axis to residue i in
(A) Change in
(deg) Change in
(deg) Angle of psi(i) axis to hinge axis
(deg) Angle of psi(i) axis to hinge axis
(deg) Percentage Progress
SER-307
ILE-308
14.4
15.2
-14.7
8.1
145.2
121.1
42.4
ILE-308
VAL-309
13.0
12.9
2.7
6.8
106.8
111.6
-69.3
VAL-309
LYS-310
12.6
12.6
-11.9
9.7
3.6
4.2
25.8
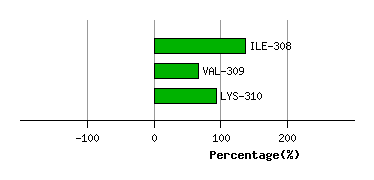
Graph shows rotational transition at bending residues and can be used
to identify hinge bending residues.
Probably only informative for interdomain rotations greater than 20 degrees