Vitamin D Hydroxylase
(All numbering and residues are taken from first PDB file)
![]()
![]()
Bending Residue Dihedral Analysis
Residue
iResidue
i+1Distance of hinge axis to residue i in
(A) Distance of hinge axis to residue i in
(A) Change in
(deg) Change in
(deg) Angle of psi(i) axis to hinge axis
(deg) Angle of psi(i) axis to hinge axis
(deg) Percentage Progress
ARG-97
LEU-98
9.5
10.1
4.8
-7.2
103.1
101.7
5.2
LEU-98
ARG-99
6.4
6.8
-9.2
6.0
27.1
28.3
11.7
ARG-99
LYS-100
6.5
7.0
-0.1
-3.5
92.1
92.5
-0.3
LYS-100
LEU-101
7.6
8.8
-10.7
-4.2
109.5
110.2
-56.2
LEU-101
VAL-102
4.8
6.3
-13.9
42.0
45.8
54.9
-110.0
VAL-102
GLY-103
2.8
3.4
-22.8
-13.1
30.4
41.2
239.7
GLY-103
ARG-104
5.3
5.9
18.6
-1.6
106.2
79.8
-41.1

Graph shows rotational transition at bending residues and can be used
to identify hinge bending residues.
Probably only informative for interdomain rotations greater than 20 degrees
Residue
iResidue
i+1Distance of hinge axis to residue i in
(A) Distance of hinge axis to residue i in
(A) Change in
(deg) Change in
(deg) Angle of psi(i) axis to hinge axis
(deg) Angle of psi(i) axis to hinge axis
(deg) Percentage Progress
SER-105
PHE-106
6.0
7.0
-29.0
41.4
154.6
143.1
44.7
PHE-106
THR-107
4.1
4.6
53.9
-25.7
42.1
39.2
192.2
THR-107
VAL-108
6.9
6.9
4.2
-16.5
32.7
24.2
-85.7
VAL-108
ARG-109
7.4
6.8
27.1
-6.2
95.8
80.1
22.8
ARG-109
ARG-110
10.8
10.1
-2.5
3.6
58.0
75.8
19.6
ARG-110
MET-111
9.7
9.3
-5.8
22.0
118.0
132.5
70.2
MET-111
ASN-112
7.7
6.9
-2.8
-20.7
140.4
143.3
-111.4
ASN-112
GLU-113
10.1
9.4
-0.6
-5.7
72.2
79.8
-33.8
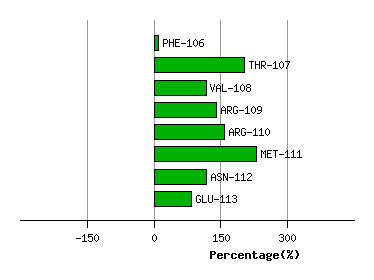
Graph shows rotational transition at bending residues and can be used
to identify hinge bending residues.
Probably only informative for interdomain rotations greater than 20 degrees
Residue
iResidue
i+1Distance of hinge axis to residue i in
(A) Distance of hinge axis to residue i in
(A) Change in
(deg) Change in
(deg) Angle of psi(i) axis to hinge axis
(deg) Angle of psi(i) axis to hinge axis
(deg) Percentage Progress
GLN-148
VAL-149
15.7
15.7
10.8
-7.6
76.4
85.8
9.6
VAL-149
ILE-150
12.4
12.4
5.0
8.6
34.2
32.3
80.1
ILE-150
CYS-151
10.7
10.7
-0.3
1.5
147.5
141.6
-3.1

Graph shows rotational transition at bending residues and can be used
to identify hinge bending residues.
Probably only informative for interdomain rotations greater than 20 degrees
Residue
iResidue
i+1Distance of hinge axis to residue i in
(A) Distance of hinge axis to residue i in
(A) Change in
(deg) Change in
(deg) Angle of psi(i) axis to hinge axis
(deg) Angle of psi(i) axis to hinge axis
(deg) Percentage Progress
GLU-196
ARG-197
12.4
11.2
33.4
-21.5
84.1
85.2
-64.6
ARG-197
LYS-198
15.2
14.3
-12.9
21.7
111.3
114.9
9.4
LYS-198
ARG-199
13.1
12.7
-7.7
11.0
50.7
51.2
-70.9
ARG-199
THR-200
11.5
11.5
-0.9
-17.4
120.8
114.8
-59.5
ARG-199
THR-200
11.5
11.5
-0.9
-17.4
120.8
114.8
-59.5

Graph shows rotational transition at bending residues and can be used
to identify hinge bending residues.
Probably only informative for interdomain rotations greater than 20 degrees
Residue
iResidue
i+1Distance of hinge axis to residue i in
(A) Distance of hinge axis to residue i in
(A) Change in
(deg) Change in
(deg) Angle of psi(i) axis to hinge axis
(deg) Angle of psi(i) axis to hinge axis
(deg) Percentage Progress
ARG-199
THR-200
11.5
11.5
-0.9
-17.4
120.8
114.8
-59.5
ARG-199
THR-200
11.5
11.5
-0.9
-17.4
120.8
114.8
-59.5
THR-200
GLU-201
15.0
15.0
-3.2
14.9
48.6
45.4
58.7
GLU-201
PRO-202
16.6
16.8
17.8
-20.0
145.8
142.7
-19.7

Graph shows rotational transition at bending residues and can be used
to identify hinge bending residues.
Probably only informative for interdomain rotations greater than 20 degrees
Residue
iResidue
i+1Distance of hinge axis to residue i in
(A) Distance of hinge axis to residue i in
(A) Change in
(deg) Change in
(deg) Angle of psi(i) axis to hinge axis
(deg) Angle of psi(i) axis to hinge axis
(deg) Percentage Progress
SER-209
LEU-210
7.8
8.8
0.3
5.7
113.0
114.8
-18.5
LEU-210
LEU-211
4.1
5.2
0.2
-4.0
161.7
173.6
20.0
LEU-211
ALA-212
5.5
6.1
9.8
-27.2
125.7
107.0
75.9
ALA-212
VAL-213
7.0
8.8
35.3
-17.7
102.9
78.2
94.1
VAL-213
SER-214
4.7
7.7
164.5
-49.0
131.9
131.7
-563.8
SER-214
ASP-215
1.6
9.4
-120.9
-87.8
16.4
131.2
-151.9
ASP-215
MET-216
3.9
12.0
-135.0
4.0
60.8
61.1
438.9
MET-216
ASP-217
5.3
15.6
56.8
13.3
99.3
135.4
-233.8
ASP-217
GLY-218
4.2
14.5
-103.5
151.2
113.1
48.3
-117.9
GLY-218
ASP-219
2.9
11.7
27.9
8.9
68.1
87.9
118.6
ASP-219
ARG-220
6.5
9.0
153.2
-44.4
22.3
63.1
747.5
ARG-220
LEU-221
6.2
5.5
-166.0
73.6
120.6
93.6
-214.7
LEU-221
SER-222
3.1
2.2
24.9
3.2
133.9
141.1
-129.6
SER-222
GLN-223
4.3
1.8
-7.5
10.9
103.9
109.0
-4.8
GLN-223
GLU-224
5.5
3.9
-5.3
13.3
134.9
125.7
28.3
GLU-224
GLU-225
8.5
6.6
-7.1
-2.1
156.4
158.1
-59.6
GLU-225
LEU-226
6.6
4.9
-12.1
16.3
117.7
127.0
2.4
LEU-226
VAL-227
4.9
3.4
-2.3
-9.8
115.4
117.6
-74.5
VAL-227
ALA-228
8.6
7.2
7.1
9.3
36.4
51.2
86.8

Graph shows rotational transition at bending residues and can be used
to identify hinge bending residues.
Probably only informative for interdomain rotations greater than 20 degrees
Residue
iResidue
i+1Distance of hinge axis to residue i in
(A) Distance of hinge axis to residue i in
(A) Change in
(deg) Change in
(deg) Angle of psi(i) axis to hinge axis
(deg) Angle of psi(i) axis to hinge axis
(deg) Percentage Progress
ALA-230
MET-231
7.6
6.8
-7.0
-2.4
58.8
62.1
27.9
MET-231
LEU-232
10.6
9.8
13.2
-12.6
153.7
144.2
0.6
LEU-232
LEU-233
9.1
8.5
6.6
4.7
131.8
145.2
-80.2
LEU-233
LEU-234
7.0
6.5
9.4
-15.9
108.7
116.8
41.8
LEU-234
ILE-235
10.6
10.1
3.7
-6.4
135.2
121.7
19.4
ILE-235
ALA-236
12.1
11.9
-2.6
-16.3
27.6
32.7
117.1
ALA-236
GLY-237
9.4
9.6
9.6
-23.8
119.8
133.7
67.6

Graph shows rotational transition at bending residues and can be used
to identify hinge bending residues.
Probably only informative for interdomain rotations greater than 20 degrees
Residue
iResidue
i+1Distance of hinge axis to residue i in
(A) Distance of hinge axis to residue i in
(A) Change in
(deg) Change in
(deg) Angle of psi(i) axis to hinge axis
(deg) Angle of psi(i) axis to hinge axis
(deg) Percentage Progress
GLU-239
THR-240
13.9
14.2
-47.9
55.9
137.8
143.0
20.4
THR-240
THR-241
11.1
11.6
22.8
-12.0
38.5
48.6
70.5
THR-241
VAL-242
9.7
10.1
-2.0
-2.4
118.2
118.2
8.9

Graph shows rotational transition at bending residues and can be used
to identify hinge bending residues.
Probably only informative for interdomain rotations greater than 20 degrees