Aspartate Aminotransferase
(All numbering and residues are taken from first PDB file)
![]()
![]()
Bending Residue Dihedral Analysis
Residue
iResidue
i+1Distance of hinge axis to residue i in
(A) Distance of hinge axis to residue i in
(A) Change in
(deg) Change in
(deg) Angle of psi(i) axis to hinge axis
(deg) Angle of psi(i) axis to hinge axis
(deg) Percentage Progress
GLY-36
ILE-37
13.4
13.3
113.1
-25.6
92.3
119.6
-232.9
ILE-37
GLY-38
13.4
12.8
-3.2
-8.6
73.0
114.1
64.8
GLY-38
VAL-39
10.8
12.4
-49.1
-5.8
33.1
47.5
552.0
VAL-39
TYR-40
10.8
11.0
35.2
-24.0
115.8
110.0
40.9
TYR-40
LYS-41
7.6
7.8
-17.7
15.3
42.8
36.8
38.7
LYS-41
ASP-42
6.3
6.7
3.8
0.7
66.5
70.7
84.5
LYS-41
ASP-42
6.3
6.7
3.8
0.7
66.5
70.7
84.5
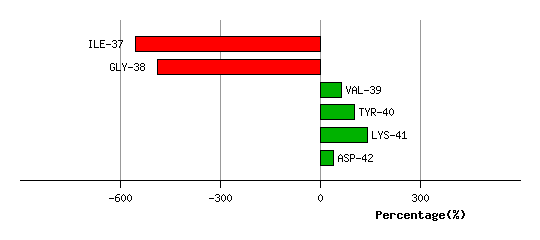
Graph shows rotational transition at bending residues and can be used
to identify hinge bending residues.
Probably only informative for interdomain rotations greater than 20 degrees
Residue
iResidue
i+1Distance of hinge axis to residue i in
(A) Distance of hinge axis to residue i in
(A) Change in
(deg) Change in
(deg) Angle of psi(i) axis to hinge axis
(deg) Angle of psi(i) axis to hinge axis
(deg) Percentage Progress
LYS-41
ASP-42
6.3
6.7
3.8
0.7
66.5
70.7
84.5
LYS-41
ASP-42
6.3
6.7
3.8
0.7
66.5
70.7
84.5
ASP-42
GLU-43
3.5
3.9
11.9
0.2
83.4
82.1
104.0
GLU-43
THR-44
4.1
3.8
-19.8
10.3
112.9
113.4
-69.2
THR-44
GLY-45
6.7
6.5
4.7
11.7
55.5
61.3
74.1
THR-44
GLY-45
6.7
6.5
4.7
11.7
55.5
61.3
74.1

Graph shows rotational transition at bending residues and can be used
to identify hinge bending residues.
Probably only informative for interdomain rotations greater than 20 degrees
Residue
iResidue
i+1Distance of hinge axis to residue i in
(A) Distance of hinge axis to residue i in
(A) Change in
(deg) Change in
(deg) Angle of psi(i) axis to hinge axis
(deg) Angle of psi(i) axis to hinge axis
(deg) Percentage Progress
THR-44
GLY-45
6.7
6.5
4.7
11.7
55.5
61.3
74.1
THR-44
GLY-45
6.7
6.5
4.7
11.7
55.5
61.3
74.1
GLY-45
LYS-46
8.2
8.5
-27.9
2.8
68.7
75.3
9.5
LYS-46
THR-47
9.0
9.1
4.3
2.5
62.0
68.3
-15.3

Graph shows rotational transition at bending residues and can be used
to identify hinge bending residues.
Probably only informative for interdomain rotations greater than 20 degrees
Residue
iResidue
i+1Distance of hinge axis to residue i in
(A) Distance of hinge axis to residue i in
(A) Change in
(deg) Change in
(deg) Angle of psi(i) axis to hinge axis
(deg) Angle of psi(i) axis to hinge axis
(deg) Percentage Progress
GLN-331
ARG-332
4.5
4.7
4.4
4.2
76.6
72.3
25.2
ARG-332
MET-333
5.7
5.9
-4.4
9.2
74.8
65.3
91.5
MET-333
ARG-334
4.6
4.8
-17.6
-1.9
13.4
15.0
290.3

Graph shows rotational transition at bending residues and can be used
to identify hinge bending residues.
Probably only informative for interdomain rotations greater than 20 degrees
Residue
iResidue
i+1Distance of hinge axis to residue i in
(A) Distance of hinge axis to residue i in
(A) Change in
(deg) Change in
(deg) Angle of psi(i) axis to hinge axis
(deg) Angle of psi(i) axis to hinge axis
(deg) Percentage Progress
PHE-350
SER-351
9.4
9.6
-2.3
-4.7
70.9
72.7
59.8
SER-351
PHE-352
9.1
9.2
-10.5
10.8
103.4
103.3
-30.7
PHE-352
ILE-353
5.7
6.0
9.3
-13.3
139.5
141.6
110.0

Graph shows rotational transition at bending residues and can be used
to identify hinge bending residues.
Probably only informative for interdomain rotations greater than 20 degrees
Residue
iResidue
i+1Distance of hinge axis to residue i in
(A) Distance of hinge axis to residue i in
(A) Change in
(deg) Change in
(deg) Angle of psi(i) axis to hinge axis
(deg) Angle of psi(i) axis to hinge axis
(deg) Percentage Progress
MET-359
PHE-360
5.1
4.5
1.4
8.4
125.1
133.5
-75.5
PHE-360
SER-361
5.1
5.3
-16.5
-15.7
53.2
46.1
384.5
SER-361
PHE-362
4.0
4.1
17.3
-4.7
130.9
117.9
1.4
PHE-362
SER-363
5.8
6.3
17.0
-11.0
92.9
83.8
-95.2
SER-363
GLY-364
7.9
8.0
35.9
-17.8
148.4
148.2
-179.4

Graph shows rotational transition at bending residues and can be used
to identify hinge bending residues.
Probably only informative for interdomain rotations greater than 20 degrees