Flavocytochrome C Fumarate Reductase
(All numbering and residues are taken from first PDB file)
![]()
![]()
Bending Residue Dihedral Analysis
Residue
iResidue
i+1Distance of hinge axis to residue i in
(A) Distance of hinge axis to residue i in
(A) Change in
(deg) Change in
(deg) Angle of psi(i) axis to hinge axis
(deg) Angle of psi(i) axis to hinge axis
(deg) Percentage Progress
CYS-84
ASP-85
7.4
7.2
4.6
-12.4
50.8
50.4
-248.7
ASP-85
ALA-86
10.8
10.5
13.2
6.4
14.4
21.9
462.4
ALA-86
CYS-87
9.5
9.2
-7.5
7.4
113.9
120.4
-55.7

Graph shows rotational transition at bending residues and can be used
to identify hinge bending residues.
Probably only informative for interdomain rotations greater than 20 degrees
Residue
iResidue
i+1Distance of hinge axis to residue i in
(A) Distance of hinge axis to residue i in
(A) Change in
(deg) Change in
(deg) Angle of psi(i) axis to hinge axis
(deg) Angle of psi(i) axis to hinge axis
(deg) Percentage Progress
HIS-88
SER-89
9.5
9.7
-11.1
10.7
102.9
105.6
-76.6
SER-89
PHE-90
13.1
13.1
9.5
2.0
32.0
31.6
425.6
PHE-90
GLY-91
12.8
12.7
-2.1
1.2
122.2
125.2
-94.5

Graph shows rotational transition at bending residues and can be used
to identify hinge bending residues.
Probably only informative for interdomain rotations greater than 20 degrees
Residue
iResidue
i+1Distance of hinge axis to residue i in
(A) Distance of hinge axis to residue i in
(A) Change in
(deg) Change in
(deg) Angle of psi(i) axis to hinge axis
(deg) Angle of psi(i) axis to hinge axis
(deg) Percentage Progress
PRO-95
PHE-96
17.5
17.3
8.9
-11.6
51.3
49.2
63.8
PHE-96
GLY-97
20.1
20.0
9.9
25.0
14.5
18.7
699.3
GLY-97
GLY-98
18.9
18.9
23.3
-52.4
38.0
36.6
-436.0

Graph shows rotational transition at bending residues and can be used
to identify hinge bending residues.
Probably only informative for interdomain rotations greater than 20 degrees
Residue
iResidue
i+1Distance of hinge axis to residue i in
(A) Distance of hinge axis to residue i in
(A) Change in
(deg) Change in
(deg) Angle of psi(i) axis to hinge axis
(deg) Angle of psi(i) axis to hinge axis
(deg) Percentage Progress
LYS-99
TRP-100
18.4
18.4
-8.7
-4.6
56.4
65.1
263.5
TRP-100
GLU-101
15.6
15.5
2.7
4.3
151.0
153.7
-234.2
GLU-101
ARG-102
16.9
17.0
-8.6
1.5
71.5
70.0
174.4

Graph shows rotational transition at bending residues and can be used
to identify hinge bending residues.
Probably only informative for interdomain rotations greater than 20 degrees
Residue
iResidue
i+1Distance of hinge axis to residue i in
(A) Distance of hinge axis to residue i in
(A) Change in
(deg) Change in
(deg) Angle of psi(i) axis to hinge axis
(deg) Angle of psi(i) axis to hinge axis
(deg) Percentage Progress
THR-164
LYS-165
6.9
7.0
-1.3
-4.3
36.0
39.8
100.9
LYS-165
LEU-166
5.7
5.6
-11.3
19.7
93.7
93.5
-172.3
LEU-166
ALA-167
3.6
3.4
-1.0
7.7
122.1
115.1
296.1
ALA-167
ALA-168
6.6
6.6
-19.8
32.9
118.7
114.6
244.9
ALA-167
ALA-168
6.6
6.6
-19.8
32.9
118.7
114.6
244.9

Graph shows rotational transition at bending residues and can be used
to identify hinge bending residues.
Probably only informative for interdomain rotations greater than 20 degrees
Residue
iResidue
i+1Distance of hinge axis to residue i in
(A) Distance of hinge axis to residue i in
(A) Change in
(deg) Change in
(deg) Angle of psi(i) axis to hinge axis
(deg) Angle of psi(i) axis to hinge axis
(deg) Percentage Progress
ALA-167
ALA-168
6.6
6.6
-19.8
32.9
118.7
114.6
244.9
ALA-167
ALA-168
6.6
6.6
-19.8
32.9
118.7
114.6
244.9
ALA-168
GLY-169
9.4
9.0
-14.1
-33.6
66.8
78.1
131.3
GLY-169
GLY-170
12.1
12.2
50.0
-12.5
91.9
102.4
-281.1

Graph shows rotational transition at bending residues and can be used
to identify hinge bending residues.
Probably only informative for interdomain rotations greater than 20 degrees
Residue
iResidue
i+1Distance of hinge axis to residue i in
(A) Distance of hinge axis to residue i in
(A) Change in
(deg) Change in
(deg) Angle of psi(i) axis to hinge axis
(deg) Angle of psi(i) axis to hinge axis
(deg) Percentage Progress
MET-225
GLY-226
21.8
21.5
-16.2
24.9
51.0
51.4
-62.3
GLY-226
ALA-227
20.4
19.9
-1.4
-4.2
115.2
112.5
226.8
ALA-227
ASP-228
18.6
18.4
0.0
-1.4
86.8
87.4
-52.8
ASP-228
MET-229
19.3
18.6
-13.9
12.4
147.5
146.4
-153.3
MET-229
THR-230
19.7
19.3
37.5
-43.1
77.3
85.9
-94.2

Graph shows rotational transition at bending residues and can be used
to identify hinge bending residues.
Probably only informative for interdomain rotations greater than 20 degrees
Residue
iResidue
i+1Distance of hinge axis to residue i in
(A) Distance of hinge axis to residue i in
(A) Change in
(deg) Change in
(deg) Angle of psi(i) axis to hinge axis
(deg) Angle of psi(i) axis to hinge axis
(deg) Percentage Progress
ASP-231
VAL-232
21.1
20.9
-5.1
14.0
173.9
165.5
161.8
VAL-232
GLY-233
21.6
21.2
14.4
-6.6
64.3
63.8
187.5
GLY-233
ARG-234
20.7
20.3
7.7
-16.2
19.6
14.1
-225.1
ARG-234
MET-235
19.8
19.6
-29.6
27.5
85.0
79.5
-94.1
ARG-234
MET-235
19.8
19.6
-29.6
27.5
85.0
79.5
-94.1

Graph shows rotational transition at bending residues and can be used
to identify hinge bending residues.
Probably only informative for interdomain rotations greater than 20 degrees
Residue
iResidue
i+1Distance of hinge axis to residue i in
(A) Distance of hinge axis to residue i in
(A) Change in
(deg) Change in
(deg) Angle of psi(i) axis to hinge axis
(deg) Angle of psi(i) axis to hinge axis
(deg) Percentage Progress
ARG-234
MET-235
19.8
19.6
-29.6
27.5
85.0
79.5
-94.1
ARG-234
MET-235
19.8
19.6
-29.6
27.5
85.0
79.5
-94.1
MET-235
GLY-236
16.4
16.2
-11.0
17.0
11.6
20.5
9.3
GLY-236
GLY-237
15.9
15.7
-2.9
-3.1
51.0
55.9
17.2

Graph shows rotational transition at bending residues and can be used
to identify hinge bending residues.
Probably only informative for interdomain rotations greater than 20 degrees
Residue
iResidue
i+1Distance of hinge axis to residue i in
(A) Distance of hinge axis to residue i in
(A) Change in
(deg) Change in
(deg) Angle of psi(i) axis to hinge axis
(deg) Angle of psi(i) axis to hinge axis
(deg) Percentage Progress
SER-243
HIS-244
17.9
17.6
-13.6
10.6
16.6
12.7
25.9
HIS-244
ARG-245
18.4
18.2
-3.3
10.4
50.9
52.7
-15.6
ARG-245
PRO-246
16.5
16.2
21.9
-19.4
151.5
156.4
22.2
PRO-246
THR-247
17.0
16.5
20.8
-31.0
103.4
100.2
20.9
THR-247
GLY-248
19.8
19.0
6.9
-11.6
94.4
95.0
-227.9
THR-247
GLY-248
19.8
19.0
6.9
-11.6
94.4
95.0
-227.9

Graph shows rotational transition at bending residues and can be used
to identify hinge bending residues.
Probably only informative for interdomain rotations greater than 20 degrees
Residue
iResidue
i+1Distance of hinge axis to residue i in
(A) Distance of hinge axis to residue i in
(A) Change in
(deg) Change in
(deg) Angle of psi(i) axis to hinge axis
(deg) Angle of psi(i) axis to hinge axis
(deg) Percentage Progress
THR-247
GLY-248
19.8
19.0
6.9
-11.6
94.4
95.0
-227.9
THR-247
GLY-248
19.8
19.0
6.9
-11.6
94.4
95.0
-227.9
GLY-248
GLY-249
19.7
19.5
10.3
10.0
49.7
56.0
286.7
GLY-249
ALA-250
17.2
16.8
1.9
-5.8
110.3
109.8
-12.1

Graph shows rotational transition at bending residues and can be used
to identify hinge bending residues.
Probably only informative for interdomain rotations greater than 20 degrees
Residue
iResidue
i+1Distance of hinge axis to residue i in
(A) Distance of hinge axis to residue i in
(A) Change in
(deg) Change in
(deg) Angle of psi(i) axis to hinge axis
(deg) Angle of psi(i) axis to hinge axis
(deg) Percentage Progress
GLY-251
VAL-252
11.2
10.9
-20.9
15.8
95.6
96.0
-66.2
VAL-252
GLY-253
11.7
11.7
5.8
-13.9
80.2
94.3
-65.9
GLY-253
ALA-254
8.5
8.7
2.1
8.4
29.2
30.7
272.2

Graph shows rotational transition at bending residues and can be used
to identify hinge bending residues.
Probably only informative for interdomain rotations greater than 20 degrees
Residue
iResidue
i+1Distance of hinge axis to residue i in
(A) Distance of hinge axis to residue i in
(A) Change in
(deg) Change in
(deg) Angle of psi(i) axis to hinge axis
(deg) Angle of psi(i) axis to hinge axis
(deg) Percentage Progress
PHE-315
ALA-316
7.6
7.5
-4.3
0.3
92.9
89.0
152.6
ALA-316
LYS-317
4.7
4.6
175.0
177.7
126.2
133.3
366.3
LYS-317
ASN-318
7.0
7.1
-11.8
1.0
117.7
112.6
-334.8

Graph shows rotational transition at bending residues and can be used
to identify hinge bending residues.
Probably only informative for interdomain rotations greater than 20 degrees
Residue
iResidue
i+1Distance of hinge axis to residue i in
(A) Distance of hinge axis to residue i in
(A) Change in
(deg) Change in
(deg) Angle of psi(i) axis to hinge axis
(deg) Angle of psi(i) axis to hinge axis
(deg) Percentage Progress
ARG-321
VAL-322
11.2
11.2
0.8
-7.4
109.3
113.7
-29.5
VAL-322
SER-323
7.9
7.8
-2.6
15.2
38.1
48.0
25.9
SER-323
LYS-324
10.2
10.2
-14.8
24.0
29.7
35.9
-272.3
LYS-324
TYR-325
11.1
10.9
-8.1
-16.9
53.6
46.7
295.2
TYR-325
ASP-326
7.6
7.5
32.5
-25.2
102.6
99.9
47.0
ASP-326
PRO-327
6.8
6.8
-12.8
-2.6
110.5
115.8
-202.4
PRO-327
LYS-328
10.5
10.4
31.2
-24.9
69.5
77.6
-172.0
LYS-328
LEU-329
10.3
10.3
1.0
11.6
6.8
6.3
311.5

Graph shows rotational transition at bending residues and can be used
to identify hinge bending residues.
Probably only informative for interdomain rotations greater than 20 degrees
Residue
iResidue
i+1Distance of hinge axis to residue i in
(A) Distance of hinge axis to residue i in
(A) Change in
(deg) Change in
(deg) Angle of psi(i) axis to hinge axis
(deg) Angle of psi(i) axis to hinge axis
(deg) Percentage Progress
PHE-332
LYS-333
11.2
11.2
-0.2
-4.7
25.2
28.3
129.0
LYS-333
ALA-334
9.9
9.8
7.3
-5.7
86.5
85.9
30.8
ALA-334
THR-335
6.3
6.2
-3.8
-1.0
31.4
37.8
132.0

Graph shows rotational transition at bending residues and can be used
to identify hinge bending residues.
Probably only informative for interdomain rotations greater than 20 degrees
Residue
iResidue
i+1Distance of hinge axis to residue i in
(A) Distance of hinge axis to residue i in
(A) Change in
(deg) Change in
(deg) Angle of psi(i) axis to hinge axis
(deg) Angle of psi(i) axis to hinge axis
(deg) Percentage Progress
GLY-339
ALA-340
9.9
9.4
-29.7
11.1
28.9
17.3
347.1
ALA-340
THR-341
7.9
8.0
1.6
-5.2
137.1
133.3
116.3
THR-341
GLY-342
10.6
10.6
2.9
-13.4
140.3
138.3
34.2
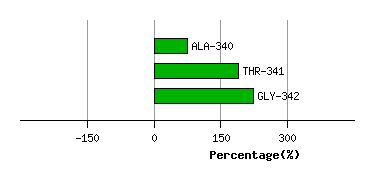
Graph shows rotational transition at bending residues and can be used
to identify hinge bending residues.
Probably only informative for interdomain rotations greater than 20 degrees
Residue
iResidue
i+1Distance of hinge axis to residue i in
(A) Distance of hinge axis to residue i in
(A) Change in
(deg) Change in
(deg) Angle of psi(i) axis to hinge axis
(deg) Angle of psi(i) axis to hinge axis
(deg) Percentage Progress
TYR-360
ILE-361
2.0
2.1
7.0
-18.8
166.3
168.1
112.6
ILE-361
GLN-362
0.7
0.7
-3.7
-13.0
73.9
72.0
-19.2
GLN-362
ALA-363
2.8
2.6
-17.7
12.2
57.9
47.4
-21.6

Graph shows rotational transition at bending residues and can be used
to identify hinge bending residues.
Probably only informative for interdomain rotations greater than 20 degrees
Residue
iResidue
i+1Distance of hinge axis to residue i in
(A) Distance of hinge axis to residue i in
(A) Change in
(deg) Change in
(deg) Angle of psi(i) axis to hinge axis
(deg) Angle of psi(i) axis to hinge axis
(deg) Percentage Progress
VAL-502
HIS-503
4.8
4.7
-0.3
-5.1
134.4
133.2
-12.1
HIS-503
HIS-504
1.8
1.8
7.4
8.5
94.3
93.7
22.4
HIS-504
THR-505
1.9
2.0
8.8
-14.7
152.6
150.6
88.7

Graph shows rotational transition at bending residues and can be used
to identify hinge bending residues.
Probably only informative for interdomain rotations greater than 20 degrees