Glutamate Receptor Subunit 2
(All numbering and residues are taken from first PDB file)
![]()
![]()
Bending Residue Dihedral Analysis
Residue
iResidue
i+1Distance of hinge axis to residue i in
(A) Distance of hinge axis to residue i in
(A) Change in
(deg) Change in
(deg) Angle of psi(i) axis to hinge axis
(deg) Angle of psi(i) axis to hinge axis
(deg) Percentage Progress
SER-108
LEU-109
4.6
3.7
-7.2
9.5
59.1
54.2
-8.8
LEU-109
GLY-110
1.9
1.2
0.1
28.8
46.7
49.6
73.3
GLY-110
ILE-111
3.6
4.0
-10.9
-8.8
59.2
58.5
24.2
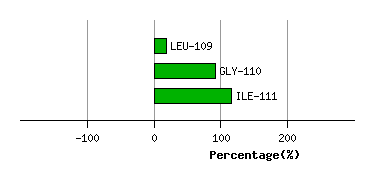
Graph shows rotational transition at bending residues and can be used
to identify hinge bending residues.
Probably only informative for interdomain rotations greater than 20 degrees
Residue
iResidue
i+1Distance of hinge axis to residue i in
(A) Distance of hinge axis to residue i in
(A) Change in
(deg) Change in
(deg) Angle of psi(i) axis to hinge axis
(deg) Angle of psi(i) axis to hinge axis
(deg) Percentage Progress
SER-217
LYS-218
2.2
2.7
15.9
-33.0
89.0
108.1
5.8
LYS-218
GLY-219
1.3
1.3
3.0
20.1
60.3
41.3
42.6
GLY-219
TYR-220
4.3
3.9
21.9
-2.7
65.5
69.4
17.0
TYR-220
GLY-221
6.9
6.8
16.2
-16.7
107.1
109.4
0.4

Graph shows rotational transition at bending residues and can be used
to identify hinge bending residues.
Probably only informative for interdomain rotations greater than 20 degrees
Residue
iResidue
i+1Distance of hinge axis to residue i in
(A) Distance of hinge axis to residue i in
(A) Change in
(deg) Change in
(deg) Angle of psi(i) axis to hinge axis
(deg) Angle of psi(i) axis to hinge axis
(deg) Percentage Progress
LYS-253
TRP-254
11.2
11.6
17.2
-23.8
109.8
110.6
-3.8
TRP-254
TRP-255
7.7
7.9
20.9
-13.8
87.2
82.3
17.3
TRP-255
TYR-256
6.3
6.6
57.0
62.6
120.9
122.5
-271.0
TYR-256
ASP-257
9.6
9.0
-162.9
-48.7
33.8
73.1
870.1
ASP-257
LYS-258
11.3
8.9
-83.5
168.5
41.9
13.4
-366.5
LYS-258
GLY-259
8.0
10.8
-26.9
2.1
90.8
58.6
23.7
GLY-259
GLU-260
7.6
8.1
-156.3
146.5
23.6
80.6
-17.4
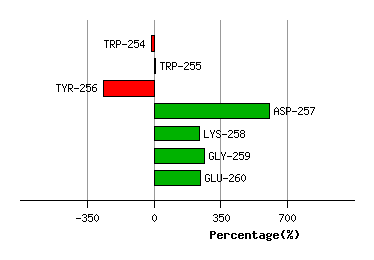
Graph shows rotational transition at bending residues and can be used
to identify hinge bending residues.
Probably only informative for interdomain rotations greater than 20 degrees