Penicillin-Binding Protein 2A
(All numbering and residues are taken from first PDB file)
![]()
![]()
Bending Residue Dihedral Analysis
Residue
iResidue
i+1Distance of hinge axis to residue i in
(A) Distance of hinge axis to residue i in
(A) Change in
(deg) Change in
(deg) Angle of psi(i) axis to hinge axis
(deg) Angle of psi(i) axis to hinge axis
(deg) Percentage Progress
TYR-169
GLU-170
5.7
5.8
0.0
2.9
165.7
162.3
52.3
GLU-170
ILE-171
5.4
5.2
0.5
4.8
59.8
60.2
9.6
ILE-171
GLY-172
7.7
7.6
10.6
-9.6
30.7
33.3
-5.2

Graph shows rotational transition at bending residues and can be used
to identify hinge bending residues.
Probably only informative for interdomain rotations greater than 20 degrees
Residue
iResidue
i+1Distance of hinge axis to residue i in
(A) Distance of hinge axis to residue i in
(A) Change in
(deg) Change in
(deg) Angle of psi(i) axis to hinge axis
(deg) Angle of psi(i) axis to hinge axis
(deg) Percentage Progress
VAL-174
PRO-175
13.8
13.8
10.0
-8.5
152.6
158.8
-28.4
PRO-175
LYS-176
14.5
14.4
5.8
-22.1
88.6
97.2
17.3
LYS-176
ASN-177
18.2
18.1
12.1
9.5
90.4
80.7
32.3

Graph shows rotational transition at bending residues and can be used
to identify hinge bending residues.
Probably only informative for interdomain rotations greater than 20 degrees
Residue
iResidue
i+1Distance of hinge axis to residue i in
(A) Distance of hinge axis to residue i in
(A) Change in
(deg) Change in
(deg) Angle of psi(i) axis to hinge axis
(deg) Angle of psi(i) axis to hinge axis
(deg) Percentage Progress
LYS-180
LYS-181
12.5
12.4
-3.3
5.7
107.3
110.1
39.1
LYS-181
ASP-182
14.1
14.1
-7.2
10.4
45.8
44.2
-32.8
ASP-182
TYR-183
13.7
13.9
-2.6
9.6
76.0
77.4
17.9

Graph shows rotational transition at bending residues and can be used
to identify hinge bending residues.
Probably only informative for interdomain rotations greater than 20 degrees
Residue
iResidue
i+1Distance of hinge axis to residue i in
(A) Distance of hinge axis to residue i in
(A) Change in
(deg) Change in
(deg) Angle of psi(i) axis to hinge axis
(deg) Angle of psi(i) axis to hinge axis
(deg) Percentage Progress
LYS-184
ALA-185
11.1
10.9
25.4
-13.7
34.3
40.3
119.9
ALA-185
ILE-186
13.7
13.6
8.5
-10.6
33.5
30.5
-15.3
ILE-186
ALA-187
11.5
11.4
-2.5
5.8
92.9
93.9
41.8

Graph shows rotational transition at bending residues and can be used
to identify hinge bending residues.
Probably only informative for interdomain rotations greater than 20 degrees
Residue
iResidue
i+1Distance of hinge axis to residue i in
(A) Distance of hinge axis to residue i in
(A) Change in
(deg) Change in
(deg) Angle of psi(i) axis to hinge axis
(deg) Angle of psi(i) axis to hinge axis
(deg) Percentage Progress
SER-191
ILE-192
9.9
10.2
3.7
-7.9
69.5
73.7
-12.2
ILE-192
SER-193
6.5
6.8
9.2
-5.2
15.2
17.5
74.6
SER-193
GLU-194
5.7
5.8
17.9
-16.3
79.5
77.1
36.9

Graph shows rotational transition at bending residues and can be used
to identify hinge bending residues.
Probably only informative for interdomain rotations greater than 20 degrees
Residue
iResidue
i+1Distance of hinge axis to residue i in
(A) Distance of hinge axis to residue i in
(A) Change in
(deg) Change in
(deg) Angle of psi(i) axis to hinge axis
(deg) Angle of psi(i) axis to hinge axis
(deg) Percentage Progress
PHE-211
VAL-212
12.2
12.0
-6.8
9.1
72.7
72.0
8.8
VAL-212
PRO-213
8.8
8.6
-3.1
4.1
106.5
107.3
-4.7
PRO-213
LEU-214
5.6
5.5
3.2
-3.6
133.8
133.2
3.0
LEU-214
LYS-215
3.8
3.7
-5.7
7.2
118.8
118.4
-5.3
LYS-215
THR-216
3.5
3.5
1.4
2.5
13.9
11.8
32.5

Graph shows rotational transition at bending residues and can be used
to identify hinge bending residues.
Probably only informative for interdomain rotations greater than 20 degrees
Residue
iResidue
i+1Distance of hinge axis to residue i in
(A) Distance of hinge axis to residue i in
(A) Change in
(deg) Change in
(deg) Angle of psi(i) axis to hinge axis
(deg) Angle of psi(i) axis to hinge axis
(deg) Percentage Progress
ASP-221
GLU-222
15.6
15.7
-49.8
51.2
63.0
59.4
-47.9
GLU-222
TYR-223
18.4
18.7
-9.1
5.3
6.8
7.8
44.1

Graph shows rotational transition at bending residues and can be used
to identify hinge bending residues.
Probably only informative for interdomain rotations greater than 20 degrees
Residue
iResidue
i+1Distance of hinge axis to residue i in
(A) Distance of hinge axis to residue i in
(A) Change in
(deg) Change in
(deg) Angle of psi(i) axis to hinge axis
(deg) Angle of psi(i) axis to hinge axis
(deg) Percentage Progress
PHE-227
ALA-228
17.1
17.1
-9.9
10.2
94.0
97.6
32.3
ALA-228
LYS-229
15.4
15.2
1.3
6.4
81.9
82.5
-26.3
LYS-229
LYS-230
18.9
18.6
3.3
-10.7
23.9
25.7
-129.2
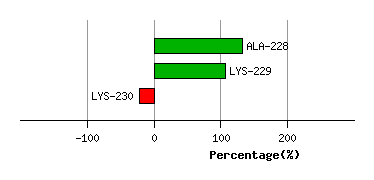
Graph shows rotational transition at bending residues and can be used
to identify hinge bending residues.
Probably only informative for interdomain rotations greater than 20 degrees
Residue
iResidue
i+1Distance of hinge axis to residue i in
(A) Distance of hinge axis to residue i in
(A) Change in
(deg) Change in
(deg) Angle of psi(i) axis to hinge axis
(deg) Angle of psi(i) axis to hinge axis
(deg) Percentage Progress
PHE-231
HIS-232
17.1
16.9
0.1
-6.9
74.7
73.7
-1.8
HIS-232
LEU-233
17.3
17.1
16.0
-15.6
74.9
78.6
26.1
LEU-233
THR-234
13.7
13.5
-4.1
3.1
150.1
151.8
-37.3

Graph shows rotational transition at bending residues and can be used
to identify hinge bending residues.
Probably only informative for interdomain rotations greater than 20 degrees