Molybdenum Cofactor Biosynthesis Protein Mog
(All numbering and residues are taken from first PDB file)
![]()
![]()
Bending Residue Dihedral Analysis
Residue
iResidue
i+1Distance of hinge axis to residue i in
(A) Distance of hinge axis to residue i in
(A) Change in
(deg) Change in
(deg) Angle of psi(i) axis to hinge axis
(deg) Angle of psi(i) axis to hinge axis
(deg) Percentage Progress
GLY-75
THR-76
6.4
6.1
19.1
-9.2
67.8
64.7
13.7
THR-76
GLY-77
3.7
3.3
25.2
-14.7
103.6
98.4
-0.9
GLY-77
PRO-78
4.9
4.7
-6.8
5.0
41.0
43.3
47.1

Graph shows rotational transition at bending residues and can be used
to identify hinge bending residues.
Probably only informative for interdomain rotations greater than 20 degrees
Residue
iResidue
i+1Distance of hinge axis to residue i in
(A) Distance of hinge axis to residue i in
(A) Change in
(deg) Change in
(deg) Angle of psi(i) axis to hinge axis
(deg) Angle of psi(i) axis to hinge axis
(deg) Percentage Progress
ARG-81
ASP-82
4.1
4.0
-6.7
-3.1
15.5
21.9
58.4
ASP-82
VAL-83
3.9
3.6
0.1
4.0
102.9
101.4
-32.3
VAL-83
THR-84
4.5
4.4
-0.1
-7.7
35.4
36.2
29.2
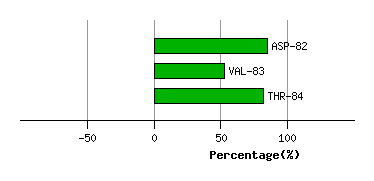
Graph shows rotational transition at bending residues and can be used
to identify hinge bending residues.
Probably only informative for interdomain rotations greater than 20 degrees
Residue
iResidue
i+1Distance of hinge axis to residue i in
(A) Distance of hinge axis to residue i in
(A) Change in
(deg) Change in
(deg) Angle of psi(i) axis to hinge axis
(deg) Angle of psi(i) axis to hinge axis
(deg) Percentage Progress
GLU-101
LEU-102
4.5
4.9
-3.4
-0.1
125.0
122.8
4.9
ARG-104
ALA-105
5.9
5.8
-2.7
13.2
129.4
131.3
9.6

Graph shows rotational transition at bending residues and can be used
to identify hinge bending residues.
Probably only informative for interdomain rotations greater than 20 degrees
Residue
iResidue
i+1Distance of hinge axis to residue i in
(A) Distance of hinge axis to residue i in
(A) Change in
(deg) Change in
(deg) Angle of psi(i) axis to hinge axis
(deg) Angle of psi(i) axis to hinge axis
(deg) Percentage Progress
ARG-118
GLN-119
1.7
2.0
-5.4
6.9
56.6
59.9
9.8
GLN-119
THR-120
1.2
0.9
-7.5
11.5
53.3
61.2
25.1
THR-120
ALA-121
3.3
3.5
-0.7
-5.2
63.4
58.8
17.3

Graph shows rotational transition at bending residues and can be used
to identify hinge bending residues.
Probably only informative for interdomain rotations greater than 20 degrees