Acetolactate Synthase, Catabolic
(All numbering and residues are taken from first PDB file)
![]()
![]()
Bending Residue Dihedral Analysis
Residue
iResidue
i+1Distance of hinge axis to residue i in
(A) Distance of hinge axis to residue i in
(A) Change in
(deg) Change in
(deg) Angle of psi(i) axis to hinge axis
(deg) Angle of psi(i) axis to hinge axis
(deg) Percentage Progress
MET-189
GLY-190
6.3
6.1
8.4
-10.9
66.1
62.3
-12.0
GLY-190
ALA-191
7.9
7.9
6.8
2.4
37.8
40.0
102.3
ALA-191
ALA-192
8.5
8.6
-3.7
-0.3
74.2
73.1
12.0

Graph shows rotational transition at bending residues and can be used
to identify hinge bending residues.
Probably only informative for interdomain rotations greater than 20 degrees
Residue
iResidue
i+1Distance of hinge axis to residue i in
(A) Distance of hinge axis to residue i in
(A) Change in
(deg) Change in
(deg) Angle of psi(i) axis to hinge axis
(deg) Angle of psi(i) axis to hinge axis
(deg) Percentage Progress
THR-239
SER-240
3.2
3.3
2.2
-2.1
43.7
45.5
-4.4
SER-240
THR-241
1.0
1.0
-3.2
2.3
79.2
80.0
16.5
THR-241
TYR-242
3.6
3.5
3.0
-3.8
100.2
101.6
3.6
TYR-242
GLN-243
6.7
6.6
5.1
-4.6
35.9
37.1
-1.2

Graph shows rotational transition at bending residues and can be used
to identify hinge bending residues.
Probably only informative for interdomain rotations greater than 20 degrees
Residue
iResidue
i+1Distance of hinge axis to residue i in
(A) Distance of hinge axis to residue i in
(A) Change in
(deg) Change in
(deg) Angle of psi(i) axis to hinge axis
(deg) Angle of psi(i) axis to hinge axis
(deg) Percentage Progress
ALA-257
GLY-258
5.0
5.1
1.1
-3.7
100.3
98.2
-12.6
GLY-258
ARG-259
2.2
2.3
12.5
-1.3
38.6
42.4
97.8
ARG-259
VAL-260
2.0
2.0
-3.8
-2.3
75.2
78.3
-18.6

Graph shows rotational transition at bending residues and can be used
to identify hinge bending residues.
Probably only informative for interdomain rotations greater than 20 degrees
Residue
iResidue
i+1Distance of hinge axis to residue i in
(A) Distance of hinge axis to residue i in
(A) Change in
(deg) Change in
(deg) Angle of psi(i) axis to hinge axis
(deg) Angle of psi(i) axis to hinge axis
(deg) Percentage Progress
ASN-265
GLN-266
6.0
6.0
24.3
-27.5
118.3
117.8
78.7
GLN-266
ALA-267
3.8
3.9
1.6
1.1
102.9
104.0
21.0
ALA-267
GLY-268
5.6
5.7
-1.1
2.0
12.7
13.6
-22.1
GLY-268
ASP-269
5.0
5.1
-5.0
1.2
78.8
78.1
16.6
ASP-269
ARG-270
7.3
7.5
4.2
0.5
75.2
72.8
7.0
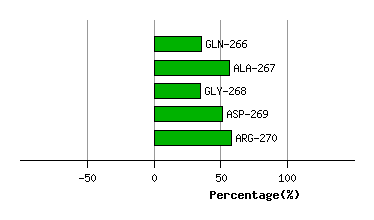
Graph shows rotational transition at bending residues and can be used
to identify hinge bending residues.
Probably only informative for interdomain rotations greater than 20 degrees
Residue
iResidue
i+1Distance of hinge axis to residue i in
(A) Distance of hinge axis to residue i in
(A) Change in
(deg) Change in
(deg) Angle of psi(i) axis to hinge axis
(deg) Angle of psi(i) axis to hinge axis
(deg) Percentage Progress
ARG-352
GLN-353
5.5
5.6
-1.6
-4.6
60.0
60.2
107.3
GLN-353
HIS-354
7.8
7.9
-3.6
2.8
22.7
20.1
-18.3
HIS-354
GLN-355
6.5
6.8
6.8
5.8
91.6
89.4
8.8

Graph shows rotational transition at bending residues and can be used
to identify hinge bending residues.
Probably only informative for interdomain rotations greater than 20 degrees