Glutamate Receptor, Ionotropic Kainate 1
(All numbering and residues are taken from first PDB file)
![]()
![]()
Bending Residue Dihedral Analysis
Residue
iResidue
i+1Distance of hinge axis to residue i in
(A) Distance of hinge axis to residue i in
(A) Change in
(deg) Change in
(deg) Angle of psi(i) axis to hinge axis
(deg) Angle of psi(i) axis to hinge axis
(deg) Percentage Progress
THR-107
LEU-108
7.8
7.0
14.8
-8.6
112.0
116.8
-13.5
LEU-108
GLY-109
4.5
3.5
-9.8
22.5
136.4
135.7
20.9
GLY-109
ILE-110
2.3
1.6
-46.0
25.3
60.6
65.7
28.5
ILE-110
SER-111
4.1
3.7
-2.3
-3.6
60.0
66.9
20.4

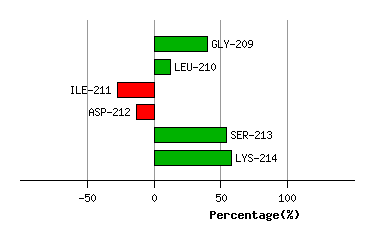
Graph shows rotational transition at bending residues and can be used
to identify hinge bending residues.
Probably only informative for interdomain rotations greater than 20 degrees
Residue
iResidue
i+1Distance of hinge axis to residue i in
(A) Distance of hinge axis to residue i in
(A) Change in
(deg) Change in
(deg) Angle of psi(i) axis to hinge axis
(deg) Angle of psi(i) axis to hinge axis
(deg) Percentage Progress
GLY-208
GLY-209
12.3
12.3
27.7
-33.4
100.3
91.8
-20.5
GLY-209
LEU-210
10.9
9.8
8.2
14.0
103.6
115.1
-28.3
LEU-210
ILE-211
7.5
6.6
-1.6
17.0
24.5
25.6
-39.8
ILE-211
ASP-212
6.7
6.7
-179.6
149.1
69.7
45.1
14.5
ASP-212
SER-213
3.8
3.7
138.8
-99.8
72.7
62.3
67.8
SER-213
LYS-214
4.5
3.2
-3.7
15.5
78.5
74.4
3.5
Graph shows rotational transition at bending residues and can be used
to identify hinge bending residues.
Probably only informative for interdomain rotations greater than 20 degrees
Residue
iResidue
i+1Distance of hinge axis to residue i in
(A) Distance of hinge axis to residue i in
(A) Change in
(deg) Change in
(deg) Angle of psi(i) axis to hinge axis
(deg) Angle of psi(i) axis to hinge axis
(deg) Percentage Progress
TRP-250
TRP-251
8.5
8.9
-8.0
-2.2
96.9
91.1
-1.6
TRP-251
ARG-252
5.2
5.8
-2.9
60.6
33.7
33.3
-133.1
ARG-252
GLY-253
5.6
6.8
-18.0
12.5
52.9
71.9
-13.1
GLY-253
ASN-254
2.7
5.2
36.3
-163.8
154.1
165.5
364.9
ASN-254
GLY-255
3.3
5.7
-49.8
141.3
72.5
85.1
-90.4

Graph shows rotational transition at bending residues and can be used
to identify hinge bending residues.
Probably only informative for interdomain rotations greater than 20 degrees