Alcohol Dehydrogenase, Iron-Containing
(All numbering and residues are taken from first PDB file)
![]()
![]()
Bending Residue Dihedral Analysis
Residue
iResidue
i+1Distance of hinge axis to residue i in
(A) Distance of hinge axis to residue i in
(A) Change in
(deg) Change in
(deg) Angle of psi(i) axis to hinge axis
(deg) Angle of psi(i) axis to hinge axis
(deg) Percentage Progress
GLU-196
GLY-197
8.1
8.1
-2.4
2.5
146.2
147.7
25.1
GLY-197
TYR-198
7.8
7.8
-4.3
2.5
144.1
142.6
-69.7
TYR-198
LEU-199
7.1
7.2
2.5
0.4
89.6
91.1
82.4

Graph shows rotational transition at bending residues and can be used
to identify hinge bending residues.
Probably only informative for interdomain rotations greater than 20 degrees
Residue
iResidue
i+1Distance of hinge axis to residue i in
(A) Distance of hinge axis to residue i in
(A) Change in
(deg) Change in
(deg) Angle of psi(i) axis to hinge axis
(deg) Angle of psi(i) axis to hinge axis
(deg) Percentage Progress
ARG-201
LYS-202
15.4
15.5
-0.7
-3.7
59.1
55.4
145.3
LYS-202
SER-203
14.4
14.4
1.3
1.0
115.9
115.0
-82.1
SER-203
THR-204
10.9
10.9
-0.7
0.3
20.8
20.0
51.1

Graph shows rotational transition at bending residues and can be used
to identify hinge bending residues.
Probably only informative for interdomain rotations greater than 20 degrees
Residue
iResidue
i+1Distance of hinge axis to residue i in
(A) Distance of hinge axis to residue i in
(A) Change in
(deg) Change in
(deg) Angle of psi(i) axis to hinge axis
(deg) Angle of psi(i) axis to hinge axis
(deg) Percentage Progress
GLY-251
THR-252
12.9
13.0
-6.9
3.8
69.9
68.6
99.2
THR-252
THR-253
11.5
11.6
-0.9
-1.2
85.8
84.9
14.4
THR-253
LEU-254
13.1
13.1
-3.2
0.0
17.4
16.0
53.9

Graph shows rotational transition at bending residues and can be used
to identify hinge bending residues.
Probably only informative for interdomain rotations greater than 20 degrees
Residue
iResidue
i+1Distance of hinge axis to residue i in
(A) Distance of hinge axis to residue i in
(A) Change in
(deg) Change in
(deg) Angle of psi(i) axis to hinge axis
(deg) Angle of psi(i) axis to hinge axis
(deg) Percentage Progress
HIS-256
ALA-257
10.6
10.6
-2.3
3.2
131.9
132.8
-29.7
ALA-257
LEU-258
14.0
14.0
-1.5
-1.3
143.5
143.4
-18.4
LEU-258
GLY-259
13.7
13.7
2.9
-1.0
50.0
50.9
7.7
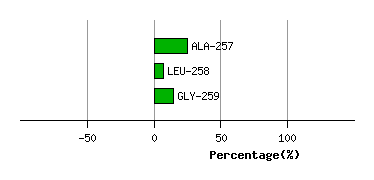
Graph shows rotational transition at bending residues and can be used
to identify hinge bending residues.
Probably only informative for interdomain rotations greater than 20 degrees
Residue
iResidue
i+1Distance of hinge axis to residue i in
(A) Distance of hinge axis to residue i in
(A) Change in
(deg) Change in
(deg) Angle of psi(i) axis to hinge axis
(deg) Angle of psi(i) axis to hinge axis
(deg) Percentage Progress
THR-263
THR-264
8.4
8.4
1.5
-3.1
137.9
139.6
23.8
THR-264
GLU-265
11.5
11.4
-1.6
0.9
26.6
26.9
51.7
GLU-265
LYS-266
11.6
11.3
5.3
-3.7
112.3
111.1
14.3
LYS-266
GLY-267
8.3
8.2
0.2
3.4
84.4
83.9
54.2
GLY-267
ILE-268
5.9
5.6
-2.8
-2.4
134.6
138.2
-75.0
ILE-268
LYS-269
4.3
4.2
-3.3
0.6
135.0
135.2
-59.1

Graph shows rotational transition at bending residues and can be used
to identify hinge bending residues.
Probably only informative for interdomain rotations greater than 20 degrees
Residue
iResidue
i+1Distance of hinge axis to residue i in
(A) Distance of hinge axis to residue i in
(A) Change in
(deg) Change in
(deg) Angle of psi(i) axis to hinge axis
(deg) Angle of psi(i) axis to hinge axis
(deg) Percentage Progress
LYS-272
ALA-273
2.6
2.6
-2.2
0.3
86.0
86.1
-105.1
ALA-273
THR-274
6.0
6.0
1.4
0.1
30.0
30.2
-0.2
THR-274
GLY-275
6.9
6.9
-1.4
1.6
108.7
108.3
74.9

Graph shows rotational transition at bending residues and can be used
to identify hinge bending residues.
Probably only informative for interdomain rotations greater than 20 degrees
Residue
iResidue
i+1Distance of hinge axis to residue i in
(A) Distance of hinge axis to residue i in
(A) Change in
(deg) Change in
(deg) Angle of psi(i) axis to hinge axis
(deg) Angle of psi(i) axis to hinge axis
(deg) Percentage Progress
GLU-310
LEU-311
13.6
13.5
2.4
-10.1
71.4
72.1
-281.0
LEU-311
GLY-312
10.5
10.5
9.2
-0.5
13.0
18.2
396.4
GLY-312
LEU-313
10.3
10.2
-1.8
2.0
97.9
96.4
57.7

Graph shows rotational transition at bending residues and can be used
to identify hinge bending residues.
Probably only informative for interdomain rotations greater than 20 degrees
Residue
iResidue
i+1Distance of hinge axis to residue i in
(A) Distance of hinge axis to residue i in
(A) Change in
(deg) Change in
(deg) Angle of psi(i) axis to hinge axis
(deg) Angle of psi(i) axis to hinge axis
(deg) Percentage Progress
VAL-317
ALA-318
9.9
10.1
-8.5
4.3
52.8
57.8
247.2
ALA-318
VAL-319
11.7
12.1
6.1
0.0
66.7
69.0
1.5
VAL-319
SER-320
14.6
14.9
2.2
0.0
116.8
119.5
30.7
SER-320
SER-321
17.8
17.9
0.9
0.9
44.8
46.2
44.5
SER-321
GLU-322
21.2
21.3
-1.2
-2.6
100.9
101.7
-59.3

Graph shows rotational transition at bending residues and can be used
to identify hinge bending residues.
Probably only informative for interdomain rotations greater than 20 degrees
Residue
iResidue
i+1Distance of hinge axis to residue i in
(A) Distance of hinge axis to residue i in
(A) Change in
(deg) Change in
(deg) Angle of psi(i) axis to hinge axis
(deg) Angle of psi(i) axis to hinge axis
(deg) Percentage Progress
ALA-334
LYS-335
20.5
20.4
-0.1
-5.5
18.4
19.8
406.9
LYS-335
HIS-336
20.9
20.9
-1.3
6.4
53.2
52.6
-224.7
HIS-336
LEU-337
17.6
17.6
-1.4
0.8
67.6
66.7
85.8

Graph shows rotational transition at bending residues and can be used
to identify hinge bending residues.
Probably only informative for interdomain rotations greater than 20 degrees
Residue
iResidue
i+1Distance of hinge axis to residue i in
(A) Distance of hinge axis to residue i in
(A) Change in
(deg) Change in
(deg) Angle of psi(i) axis to hinge axis
(deg) Angle of psi(i) axis to hinge axis
(deg) Percentage Progress
LYS-338
ASN-339
21.0
21.0
2.7
12.5
49.9
51.5
609.5
ASN-339
THR-340
17.5
17.3
-6.7
-7.6
81.4
84.3
-221.9
THR-340
PRO-341
16.6
16.6
-0.7
-0.5
116.7
115.7
72.7

Graph shows rotational transition at bending residues and can be used
to identify hinge bending residues.
Probably only informative for interdomain rotations greater than 20 degrees