Inosine Triphosphate Pyrophosphatase
(All numbering and residues are taken from first PDB file)
![]()
![]()
Bending Residue Dihedral Analysis
Residue
iResidue
i+1Distance of hinge axis to residue i in
(A) Distance of hinge axis to residue i in
(A) Change in
(deg) Change in
(deg) Angle of psi(i) axis to hinge axis
(deg) Angle of psi(i) axis to hinge axis
(deg) Percentage Progress
ILE-10
VAL-11
9.0
8.5
6.2
-14.7
108.7
109.5
-1.0
VAL-11
PHE-12
7.6
7.2
-7.4
11.8
112.0
96.1
13.5
PHE-12
VAL-13
5.4
4.6
-19.9
-13.2
45.3
38.9
91.0

Graph shows rotational transition at bending residues and can be used
to identify hinge bending residues.
Probably only informative for interdomain rotations greater than 20 degrees
Residue
iResidue
i+1Distance of hinge axis to residue i in
(A) Distance of hinge axis to residue i in
(A) Change in
(deg) Change in
(deg) Angle of psi(i) axis to hinge axis
(deg) Angle of psi(i) axis to hinge axis
(deg) Percentage Progress
GLN-25
ILE-26
8.2
9.3
21.9
-10.5
110.2
122.4
-48.4
ILE-26
LEU-27
4.8
5.9
-15.7
-5.7
87.9
80.2
-30.4
LEU-27
GLY-28
3.8
4.8
129.2
-156.1
135.8
110.1
89.5
GLY-28
ASP-29
6.5
7.7
51.4
-10.4
79.0
74.3
111.4
ASP-29
LYS-30
9.9
10.0
23.5
3.3
81.7
97.5
14.7
LYS-30
PHE-31
10.0
7.5
1.3
-36.6
30.0
43.6
-77.1
PHE-31
PRO-32
8.4
7.4
5.5
22.6
58.7
71.3
46.3
PRO-32
CYS-33
11.7
10.5
-15.6
-3.0
162.6
166.9
-86.8

Graph shows rotational transition at bending residues and can be used
to identify hinge bending residues.
Probably only informative for interdomain rotations greater than 20 degrees
Residue
iResidue
i+1Distance of hinge axis to residue i in
(A) Distance of hinge axis to residue i in
(A) Change in
(deg) Change in
(deg) Angle of psi(i) axis to hinge axis
(deg) Angle of psi(i) axis to hinge axis
(deg) Percentage Progress
GLN-38
LYS-39
9.9
9.4
-22.8
-0.1
65.9
66.2
33.5
LYS-39
ILE-40
9.4
9.8
-2.1
-20.0
36.7
19.0
58.9
ILE-40
ASP-41
6.3
7.6
8.5
-22.5
113.9
78.9
31.8
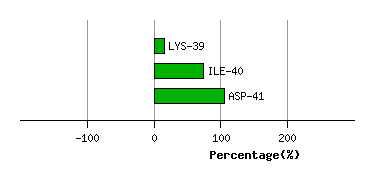
Graph shows rotational transition at bending residues and can be used
to identify hinge bending residues.
Probably only informative for interdomain rotations greater than 20 degrees
Residue
iResidue
i+1Distance of hinge axis to residue i in
(A) Distance of hinge axis to residue i in
(A) Change in
(deg) Change in
(deg) Angle of psi(i) axis to hinge axis
(deg) Angle of psi(i) axis to hinge axis
(deg) Percentage Progress
PRO-43
GLU-44
6.4
7.4
-22.7
-5.6
31.8
55.3
79.1
GLU-44
TYR-45
9.2
9.2
-8.1
50.6
111.8
120.7
105.2
TYR-45
GLN-46
10.9
11.6
10.0
11.5
116.4
121.8
-28.2

Graph shows rotational transition at bending residues and can be used
to identify hinge bending residues.
Probably only informative for interdomain rotations greater than 20 degrees