Cytoglobin
(All numbering and residues are taken from first PDB file)
![]()
![]()
Bending Residue Dihedral Analysis
Residue
iResidue
i+1Distance of hinge axis to residue i in
(A) Distance of hinge axis to residue i in
(A) Change in
(deg) Change in
(deg) Angle of psi(i) axis to hinge axis
(deg) Angle of psi(i) axis to hinge axis
(deg) Percentage Progress
MET-86
GLY-87
11.9
12.0
11.6
-11.0
17.6
16.8
19.9
GLY-87
ALA-88
11.7
11.8
2.5
0.4
81.5
77.5
25.3
ALA-88
LEU-89
8.6
8.7
4.5
-1.6
114.1
113.7
-17.3

Graph shows rotational transition at bending residues and can be used
to identify hinge bending residues.
Probably only informative for interdomain rotations greater than 20 degrees
Residue
iResidue
i+1Distance of hinge axis to residue i in
(A) Distance of hinge axis to residue i in
(A) Change in
(deg) Change in
(deg) Angle of psi(i) axis to hinge axis
(deg) Angle of psi(i) axis to hinge axis
(deg) Percentage Progress
LEU-106
ALA-107
5.8
5.5
-9.6
7.1
86.1
88.9
-35.1
ALA-107
LEU-108
8.9
8.8
4.8
-15.4
101.8
99.3
7.4
LEU-108
VAL-109
10.3
10.1
7.7
8.1
33.3
40.9
74.4
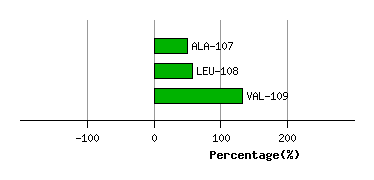
Graph shows rotational transition at bending residues and can be used
to identify hinge bending residues.
Probably only informative for interdomain rotations greater than 20 degrees
Residue
iResidue
i+1Distance of hinge axis to residue i in
(A) Distance of hinge axis to residue i in
(A) Change in
(deg) Change in
(deg) Angle of psi(i) axis to hinge axis
(deg) Angle of psi(i) axis to hinge axis
(deg) Percentage Progress
VAL-130
ILE-131
7.6
8.0
-6.3
4.5
132.0
128.0
-59.6
ILE-131
LEU-132
7.8
8.0
-4.4
4.9
71.0
64.4
40.4
LEU-132
GLU-133
6.6
6.7
-10.7
2.6
38.9
43.7
39.2

Graph shows rotational transition at bending residues and can be used
to identify hinge bending residues.
Probably only informative for interdomain rotations greater than 20 degrees
Residue
iResidue
i+1Distance of hinge axis to residue i in
(A) Distance of hinge axis to residue i in
(A) Change in
(deg) Change in
(deg) Angle of psi(i) axis to hinge axis
(deg) Angle of psi(i) axis to hinge axis
(deg) Percentage Progress
GLY-156
LEU-157
4.2
4.4
-2.5
6.4
21.0
23.7
4.1
LEU-157
ILE-158
4.1
4.5
0.9
-0.4
103.0
100.8
3.1
ILE-158
TYR-159
2.6
2.8
0.5
-4.6
66.5
64.7
13.8

Graph shows rotational transition at bending residues and can be used
to identify hinge bending residues.
Probably only informative for interdomain rotations greater than 20 degrees