Glutamate Receptor 2
(All numbering and residues are taken from first PDB file)
![]()
![]()
Bending Residue Dihedral Analysis
Residue
iResidue
i+1Distance of hinge axis to residue i in
(A) Distance of hinge axis to residue i in
(A) Change in
(deg) Change in
(deg) Angle of psi(i) axis to hinge axis
(deg) Angle of psi(i) axis to hinge axis
(deg) Percentage Progress
MET-107
SER-108
8.0
8.0
5.4
-7.4
19.7
15.5
-22.7
SER-108
LEU-109
6.2
6.3
-9.6
9.3
90.9
94.4
6.3
LEU-109
GLY-110
3.2
3.5
-7.0
17.2
165.4
168.9
128.7
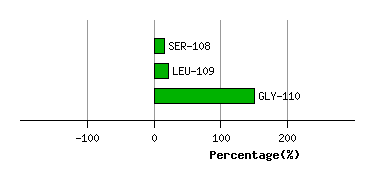
Graph shows rotational transition at bending residues and can be used
to identify hinge bending residues.
Probably only informative for interdomain rotations greater than 20 degrees
Residue
iResidue
i+1Distance of hinge axis to residue i in
(A) Distance of hinge axis to residue i in
(A) Change in
(deg) Change in
(deg) Angle of psi(i) axis to hinge axis
(deg) Angle of psi(i) axis to hinge axis
(deg) Percentage Progress
LEU-192
GLU-193
8.8
8.8
-2.5
-6.6
101.2
101.7
-63.8
GLU-193
SER-194
5.9
6.1
-9.0
9.2
117.1
123.9
-5.8
SER-194
THR-195
3.0
3.2
11.2
-4.4
5.7
5.9
85.0

Graph shows rotational transition at bending residues and can be used
to identify hinge bending residues.
Probably only informative for interdomain rotations greater than 20 degrees
Residue
iResidue
i+1Distance of hinge axis to residue i in
(A) Distance of hinge axis to residue i in
(A) Change in
(deg) Change in
(deg) Angle of psi(i) axis to hinge axis
(deg) Angle of psi(i) axis to hinge axis
(deg) Percentage Progress
TYR-199
ILE-200
5.3
5.6
-9.4
9.8
74.2
77.9
64.6
ILE-200
GLU-201
9.1
9.3
-5.0
-0.7
84.9
86.1
56.5
GLU-201
GLN-202
9.5
9.8
1.7
-2.4
156.8
154.8
-2.6

Graph shows rotational transition at bending residues and can be used
to identify hinge bending residues.
Probably only informative for interdomain rotations greater than 20 degrees
Residue
iResidue
i+1Distance of hinge axis to residue i in
(A) Distance of hinge axis to residue i in
(A) Change in
(deg) Change in
(deg) Angle of psi(i) axis to hinge axis
(deg) Angle of psi(i) axis to hinge axis
(deg) Percentage Progress
ASP-216
SER-217
1.7
2.2
-5.0
-0.6
143.6
146.6
-56.1
SER-217
LYS-218
4.4
4.8
2.7
-22.6
75.8
78.5
-109.9
LYS-218
GLY-219
6.9
7.5
-5.5
20.5
145.8
167.9
205.2
GLY-219
TYR-220
8.8
9.0
29.4
-14.0
60.9
63.9
38.9
TYR-220
GLY-221
10.6
10.8
-6.4
12.0
102.3
104.9
2.1
GLY-221
ILE-222
14.1
14.3
11.0
-10.2
56.8
52.1
-4.5

Graph shows rotational transition at bending residues and can be used
to identify hinge bending residues.
Probably only informative for interdomain rotations greater than 20 degrees
Residue
iResidue
i+1Distance of hinge axis to residue i in
(A) Distance of hinge axis to residue i in
(A) Change in
(deg) Change in
(deg) Angle of psi(i) axis to hinge axis
(deg) Angle of psi(i) axis to hinge axis
(deg) Percentage Progress
TRP-254
TRP-255
1.3
1.3
-7.5
6.3
129.3
127.6
-4.0
TRP-255
TYR-256
1.8
1.8
-4.6
9.4
72.8
71.3
-32.0
TYR-256
ASP-257
4.8
4.7
-6.8
0.5
9.6
9.9
86.9
ASP-257
LYS-258
4.7
4.6
-2.3
1.8
68.9
67.6
-13.9

Graph shows rotational transition at bending residues and can be used
to identify hinge bending residues.
Probably only informative for interdomain rotations greater than 20 degrees