Periplasmic Iron-Binding Protein
(All numbering and residues are taken from first PDB file)
![]()
![]()
Bending Residue Dihedral Analysis
Residue
iResidue
i+1Distance of hinge axis to residue i in
(A) Distance of hinge axis to residue i in
(A) Change in
(deg) Change in
(deg) Angle of psi(i) axis to hinge axis
(deg) Angle of psi(i) axis to hinge axis
(deg) Percentage Progress
GLY-125
PHE-126
4.3
4.0
-17.1
15.1
51.8
41.3
-6.5
PHE-126
THR-127
5.6
5.6
-2.1
2.6
28.4
25.3
13.5
THR-127
GLN-128
3.0
3.1
-2.4
12.1
95.3
92.9
-3.2
GLN-128
ARG-129
1.1
0.8
-2.1
-22.1
51.6
55.7
77.1
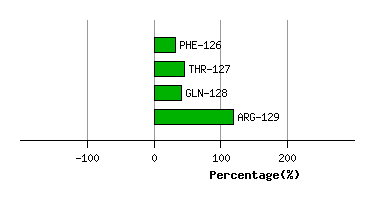
Graph shows rotational transition at bending residues and can be used
to identify hinge bending residues.
Probably only informative for interdomain rotations greater than 20 degrees
Residue
iResidue
i+1Distance of hinge axis to residue i in
(A) Distance of hinge axis to residue i in
(A) Change in
(deg) Change in
(deg) Angle of psi(i) axis to hinge axis
(deg) Angle of psi(i) axis to hinge axis
(deg) Percentage Progress
VAL-261
ASN-262
7.4
7.2
-30.8
33.9
18.4
20.1
5.5
ASN-262
VAL-263
5.2
5.2
9.5
-9.6
83.5
83.9
12.3
VAL-263
SER-264
1.6
1.5
-18.6
8.9
60.4
56.4
48.7
SER-264
GLY-265
2.1
2.8
-13.4
13.7
68.3
64.7
-26.7
GLY-265
ALA-266
3.4
3.4
-23.3
11.0
27.5
31.2
63.6

Graph shows rotational transition at bending residues and can be used
to identify hinge bending residues.
Probably only informative for interdomain rotations greater than 20 degrees
Residue
iResidue
i+1Distance of hinge axis to residue i in
(A) Distance of hinge axis to residue i in
(A) Change in
(deg) Change in
(deg) Angle of psi(i) axis to hinge axis
(deg) Angle of psi(i) axis to hinge axis
(deg) Percentage Progress
GLN-291
ARG-292
10.3
10.3
8.6
-2.9
143.6
157.0
15.2
ARG-292
TYR-293
10.2
11.6
13.0
23.8
81.9
86.6
-18.1
TYR-293
PHE-294
11.5
12.0
-29.5
8.9
143.2
97.3
-23.8
PHE-294
ALA-295
9.9
8.5
5.0
-1.6
106.1
149.7
-30.1
ALA-295
GLU-296
6.5
7.2
-12.9
-60.6
49.8
47.4
196.8
GLU-296
GLY-297
8.4
9.6
37.4
-70.5
62.3
73.6
-127.1
GLY-297
ASN-298
10.3
11.8
13.8
1.7
91.7
63.7
18.1
ASN-298
ASN-299
8.7
9.7
-28.9
4.4
50.1
67.5
50.8
ASN-299
GLU-300
6.6
6.7
-18.3
24.3
110.9
120.7
-3.8
GLU-300
TYR-301
3.3
4.1
0.2
3.8
115.0
112.3
-18.7
TYR-301
PRO-302
1.8
2.1
-24.2
-4.4
133.5
130.6
-81.4
PRO-302
VAL-303
5.3
5.6
0.2
-19.1
65.1
72.8
23.8
VAL-303
ILE-304
6.4
6.8
2.7
0.0
111.6
98.6
-2.9
VAL-303
ILE-304
6.4
6.8
2.7
0.0
111.6
98.6
-2.9

Graph shows rotational transition at bending residues and can be used
to identify hinge bending residues.
Probably only informative for interdomain rotations greater than 20 degrees
Residue
iResidue
i+1Distance of hinge axis to residue i in
(A) Distance of hinge axis to residue i in
(A) Change in
(deg) Change in
(deg) Angle of psi(i) axis to hinge axis
(deg) Angle of psi(i) axis to hinge axis
(deg) Percentage Progress
VAL-303
ILE-304
6.4
6.8
2.7
0.0
111.6
98.6
-2.9
VAL-303
ILE-304
6.4
6.8
2.7
0.0
111.6
98.6
-2.9
ILE-304
PRO-305
9.8
10.5
30.4
-13.7
163.0
156.5
-69.2
PRO-305
GLY-306
10.6
12.7
2.5
24.5
124.8
104.6
-42.1
GLY-306
VAL-307
11.4
14.0
10.1
-61.5
90.7
112.0
36.8
VAL-307
PRO-308
10.2
11.1
1.7
-19.5
128.9
118.0
80.9
PRO-308
ILE-309
8.5
8.5
15.2
30.7
67.1
71.7
59.0
ILE-309
ASP-310
4.9
4.8
-2.1
-11.3
57.4
44.1
43.4
ASP-310
PRO-311
5.5
5.4
9.2
-0.3
147.9
144.8
-26.4
PRO-311
VAL-312
4.7
4.4
1.8
-3.6
95.9
95.9
10.8

Graph shows rotational transition at bending residues and can be used
to identify hinge bending residues.
Probably only informative for interdomain rotations greater than 20 degrees