Ns3 Helicase
(All numbering and residues are taken from first PDB file)
![]()
![]()
Bending Residue Dihedral Analysis
Residue
iResidue
i+1Distance of hinge axis to residue i in
(A) Distance of hinge axis to residue i in
(A) Change in
(deg) Change in
(deg) Angle of psi(i) axis to hinge axis
(deg) Angle of psi(i) axis to hinge axis
(deg) Percentage Progress
VAL-210
VAL-211
19.2
20.1
0.7
3.6
148.2
149.3
-59.5
VAL-211
ALA-212
16.8
17.6
-6.1
2.6
44.6
46.8
33.3
ALA-212
ALA-213
19.8
20.5
-7.6
4.9
56.4
61.5
17.0
ALA-213
GLU-214
21.3
22.5
3.6
-7.5
133.6
134.3
48.2
GLU-214
MET-215
18.2
19.7
1.3
2.7
143.5
145.1
-52.8
MET-215
GLU-216
18.1
19.2
-4.0
-14.7
53.5
56.3
171.2
GLU-216
GLU-217
21.7
22.9
13.8
-3.8
131.0
118.6
-106.0
GLU-217
ALA-218
20.7
22.9
2.9
-3.0
138.5
144.0
-12.0
ALA-218
LEU-219
17.6
19.8
-18.3
14.5
49.4
44.8
44.1
LEU-219
ARG-220
19.8
21.1
1.6
-3.8
112.3
106.6
-14.7

Graph shows rotational transition at bending residues and can be used
to identify hinge bending residues.
Probably only informative for interdomain rotations greater than 20 degrees
Residue
iResidue
i+1Distance of hinge axis to residue i in
(A) Distance of hinge axis to residue i in
(A) Change in
(deg) Change in
(deg) Angle of psi(i) axis to hinge axis
(deg) Angle of psi(i) axis to hinge axis
(deg) Percentage Progress
PHE-309
PRO-310
5.9
6.2
-2.5
-4.2
13.6
11.8
41.4
PRO-310
ASP-311
4.5
4.9
-7.2
7.8
55.5
53.1
25.3
ASP-311
SER-312
4.4
5.0
-10.9
8.8
97.9
93.2
-4.7

Graph shows rotational transition at bending residues and can be used
to identify hinge bending residues.
Probably only informative for interdomain rotations greater than 20 degrees
Residue
iResidue
i+1Distance of hinge axis to residue i in
(A) Distance of hinge axis to residue i in
(A) Change in
(deg) Change in
(deg) Angle of psi(i) axis to hinge axis
(deg) Angle of psi(i) axis to hinge axis
(deg) Percentage Progress
ASP-408
SER-409
5.6
5.7
-20.4
-8.9
37.2
45.4
236.4
SER-409
ARG-410
4.2
4.6
28.6
-3.8
79.5
85.0
-82.4
ARG-410
ARG-411
1.2
1.2
6.3
8.3
135.4
135.9
-123.4
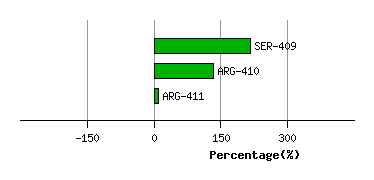
Graph shows rotational transition at bending residues and can be used
to identify hinge bending residues.
Probably only informative for interdomain rotations greater than 20 degrees
Residue
iResidue
i+1Distance of hinge axis to residue i in
(A) Distance of hinge axis to residue i in
(A) Change in
(deg) Change in
(deg) Angle of psi(i) axis to hinge axis
(deg) Angle of psi(i) axis to hinge axis
(deg) Percentage Progress
PRO-428
MET-429
3.7
3.8
-1.5
10.2
77.4
77.3
-24.0
MET-429
PRO-430
4.7
4.7
-4.8
-5.0
14.7
26.4
137.2
PRO-430
VAL-431
4.7
4.2
-0.6
9.7
46.2
44.8
-74.2
VAL-431
THR-432
4.5
4.3
-2.2
8.1
51.5
57.1
5.3
THR-432
HIS-433
6.7
6.7
-5.0
-3.7
43.3
47.2
62.1

Graph shows rotational transition at bending residues and can be used
to identify hinge bending residues.
Probably only informative for interdomain rotations greater than 20 degrees
Residue
iResidue
i+1Distance of hinge axis to residue i in
(A) Distance of hinge axis to residue i in
(A) Change in
(deg) Change in
(deg) Angle of psi(i) axis to hinge axis
(deg) Angle of psi(i) axis to hinge axis
(deg) Percentage Progress
TYR-454
LEU-455
9.2
9.3
-9.5
9.9
37.4
32.3
-9.2
LEU-455
TYR-456
10.1
10.2
0.6
-9.9
124.7
124.8
10.8
TYR-456
GLY-457
7.3
7.6
14.3
-44.1
149.5
144.2
416.7

Graph shows rotational transition at bending residues and can be used
to identify hinge bending residues.
Probably only informative for interdomain rotations greater than 20 degrees