Phosphoglucomutase 1
(All numbering and residues are taken from first PDB file)
![]()
![]()
Bending Residue Dihedral Analysis
Residue
iResidue
i+1Distance of hinge axis to residue i in
(A) Distance of hinge axis to residue i in
(A) Change in
(deg) Change in
(deg) Angle of psi(i) axis to hinge axis
(deg) Angle of psi(i) axis to hinge axis
(deg) Percentage Progress
GLY-346
ALA-347
6.1
5.8
-13.4
8.2
141.4
141.7
-3.9
ALA-347
ALA-348
4.2
4.1
-1.0
-0.1
100.0
99.5
-0.6
ALA-348
ARG-349
0.7
1.4
-4.5
10.0
157.1
157.3
29.7
ARG-349
SER-350
1.4
2.1
-3.2
2.2
89.3
86.6
-6.5
SER-350
MET-351
5.0
5.6
-2.7
1.5
115.8
114.1
-5.4
MET-351
PRO-352
7.1
7.2
2.0
5.3
175.2
174.7
-54.6
MET-351
PRO-352
7.1
7.2
2.0
5.3
175.2
174.7
-54.6

Graph shows rotational transition at bending residues and can be used
to identify hinge bending residues.
Probably only informative for interdomain rotations greater than 20 degrees
Residue
iResidue
i+1Distance of hinge axis to residue i in
(A) Distance of hinge axis to residue i in
(A) Change in
(deg) Change in
(deg) Angle of psi(i) axis to hinge axis
(deg) Angle of psi(i) axis to hinge axis
(deg) Percentage Progress
MET-351
PRO-352
7.1
7.2
2.0
5.3
175.2
174.7
-54.6
MET-351
PRO-352
7.1
7.2
2.0
5.3
175.2
174.7
-54.6
PRO-352
THR-353
7.1
7.5
-13.0
5.8
67.1
64.6
56.1
THR-353
SER-354
3.3
3.8
-2.1
-7.7
75.6
82.2
26.9

Graph shows rotational transition at bending residues and can be used
to identify hinge bending residues.
Probably only informative for interdomain rotations greater than 20 degrees
Residue
iResidue
i+1Distance of hinge axis to residue i in
(A) Distance of hinge axis to residue i in
(A) Change in
(deg) Change in
(deg) Angle of psi(i) axis to hinge axis
(deg) Angle of psi(i) axis to hinge axis
(deg) Percentage Progress
GLU-370
THR-371
5.1
4.5
31.9
-25.4
107.2
114.7
-25.8
THR-371
PRO-372
6.5
6.8
-8.2
2.9
135.5
135.8
-22.3
PRO-372
THR-373
9.6
10.1
-12.7
4.1
114.3
116.7
-41.3
THR-373
GLY-374
10.0
10.5
170.5
166.6
121.3
122.7
88.3
GLY-374
TRP-375
11.7
12.0
-35.1
35.0
73.1
45.3
-8.1
TRP-375
LYS-376
10.6
11.3
-3.3
3.0
5.1
13.6
3.3
LYS-376
PHE-377
11.3
12.9
-5.4
-3.2
69.0
64.1
21.2
PHE-377
PHE-378
8.1
9.8
13.1
-10.4
84.6
78.2
-21.4
PHE-377
PHE-378
8.1
9.8
13.1
-10.4
84.6
78.2
-21.4

Graph shows rotational transition at bending residues and can be used
to identify hinge bending residues.
Probably only informative for interdomain rotations greater than 20 degrees
Residue
iResidue
i+1Distance of hinge axis to residue i in
(A) Distance of hinge axis to residue i in
(A) Change in
(deg) Change in
(deg) Angle of psi(i) axis to hinge axis
(deg) Angle of psi(i) axis to hinge axis
(deg) Percentage Progress
PHE-377
PHE-378
8.1
9.8
13.1
-10.4
84.6
78.2
-21.4
PHE-377
PHE-378
8.1
9.8
13.1
-10.4
84.6
78.2
-21.4
PHE-378
GLY-379
6.2
7.5
19.3
5.5
33.3
31.8
129.7
GLY-379
ASN-380
8.7
9.9
-12.0
4.2
149.5
147.9
-48.9
ASN-380
LEU-381
7.0
7.9
3.7
4.2
83.8
92.6
14.2
LEU-381
MET-382
3.5
4.7
-5.5
-3.5
100.9
98.0
-14.7
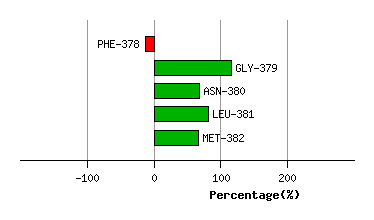
Graph shows rotational transition at bending residues and can be used
to identify hinge bending residues.
Probably only informative for interdomain rotations greater than 20 degrees
Residue
iResidue
i+1Distance of hinge axis to residue i in
(A) Distance of hinge axis to residue i in
(A) Change in
(deg) Change in
(deg) Angle of psi(i) axis to hinge axis
(deg) Angle of psi(i) axis to hinge axis
(deg) Percentage Progress
ASN-445
TYR-446
7.6
6.5
-4.6
5.8
135.6
136.5
-0.3
TYR-446
TYR-447
6.2
5.5
5.6
-12.4
110.2
114.3
17.4
TYR-447
SER-448
4.2
4.0
-0.1
8.3
127.2
126.1
47.7

Graph shows rotational transition at bending residues and can be used
to identify hinge bending residues.
Probably only informative for interdomain rotations greater than 20 degrees
Residue
iResidue
i+1Distance of hinge axis to residue i in
(A) Distance of hinge axis to residue i in
(A) Change in
(deg) Change in
(deg) Angle of psi(i) axis to hinge axis
(deg) Angle of psi(i) axis to hinge axis
(deg) Percentage Progress
TYR-529
PHE-530
9.6
9.5
7.2
-9.3
104.7
104.8
1.2
PHE-530
GLU-531
9.3
8.9
9.1
-12.2
75.9
77.5
-7.5
GLU-531
GLN-532
8.4
7.9
10.4
-17.0
98.1
96.1
46.0
GLN-532
PHE-533
10.6
9.9
-8.9
6.5
106.8
99.6
-0.5
PHE-533
GLU-534
11.8
10.4
1.0
2.2
124.6
123.4
-13.6
GLU-534
GLN-535
13.8
12.6
13.6
-16.7
62.2
66.1
10.0
GLN-535
GLN-536
16.3
15.0
-3.8
22.2
55.7
49.3
-88.0
GLN-536
GLN-537
17.4
16.5
-21.0
11.5
28.5
36.2
66.8
GLN-537
ILE-538
15.4
14.2
-10.6
8.9
99.4
102.7
13.6
ILE-538
GLN-539
12.8
11.7
6.1
-17.1
138.8
142.2
59.0
GLN-539
HIS-540
12.0
10.7
25.9
-26.3
59.4
55.0
56.8
GLN-539
HIS-540
12.0
10.7
25.9
-26.3
59.4
55.0
56.8

Graph shows rotational transition at bending residues and can be used
to identify hinge bending residues.
Probably only informative for interdomain rotations greater than 20 degrees
Residue
iResidue
i+1Distance of hinge axis to residue i in
(A) Distance of hinge axis to residue i in
(A) Change in
(deg) Change in
(deg) Angle of psi(i) axis to hinge axis
(deg) Angle of psi(i) axis to hinge axis
(deg) Percentage Progress
GLN-539
HIS-540
12.0
10.7
25.9
-26.3
59.4
55.0
56.8
GLN-539
HIS-540
12.0
10.7
25.9
-26.3
59.4
55.0
56.8
HIS-540
GLU-541
9.9
8.8
9.5
-1.6
85.0
87.2
12.4
GLU-541
THR-542
6.4
5.2
-17.7
3.1
52.7
49.9
29.8

Graph shows rotational transition at bending residues and can be used
to identify hinge bending residues.
Probably only informative for interdomain rotations greater than 20 degrees