High Level Kasugamycin Resistance Protein
(All numbering and residues are taken from first PDB file)
![]()
![]()
Bending Residue Dihedral Analysis
Residue
iResidue
i+1Distance of hinge axis to residue i in
(A) Distance of hinge axis to residue i in
(A) Change in
(deg) Change in
(deg) Angle of psi(i) axis to hinge axis
(deg) Angle of psi(i) axis to hinge axis
(deg) Percentage Progress
HIS-137
PHE-138
6.0
6.3
4.9
-6.1
134.1
133.3
5.8
PHE-138
MET-139
2.8
3.1
2.2
-3.0
123.5
125.7
11.6
MET-139
LEU-140
1.5
1.6
2.6
3.0
79.3
76.1
3.4

Graph shows rotational transition at bending residues and can be used
to identify hinge bending residues.
Probably only informative for interdomain rotations greater than 20 degrees
Residue
iResidue
i+1Distance of hinge axis to residue i in
(A) Distance of hinge axis to residue i in
(A) Change in
(deg) Change in
(deg) Angle of psi(i) axis to hinge axis
(deg) Angle of psi(i) axis to hinge axis
(deg) Percentage Progress
ALA-164
GLN-165
3.3
3.3
-0.4
1.1
56.4
54.8
21.9
GLN-165
TYR-166
3.9
4.1
-4.0
-4.9
28.0
32.8
46.5
TYR-166
TYR-167
2.3
2.4
9.8
-13.9
78.2
80.1
60.0

Graph shows rotational transition at bending residues and can be used
to identify hinge bending residues.
Probably only informative for interdomain rotations greater than 20 degrees
Residue
iResidue
i+1Distance of hinge axis to residue i in
(A) Distance of hinge axis to residue i in
(A) Change in
(deg) Change in
(deg) Angle of psi(i) axis to hinge axis
(deg) Angle of psi(i) axis to hinge axis
(deg) Percentage Progress
ASN-169
VAL-170
6.1
5.9
6.6
-11.8
164.8
161.1
71.8
VAL-170
ILE-171
6.0
5.8
7.9
-3.8
120.3
114.0
41.4
ILE-171
PRO-172
8.6
8.7
4.3
-4.7
168.7
166.2
23.9

Graph shows rotational transition at bending residues and can be used
to identify hinge bending residues.
Probably only informative for interdomain rotations greater than 20 degrees
Residue
iResidue
i+1Distance of hinge axis to residue i in
(A) Distance of hinge axis to residue i in
(A) Change in
(deg) Change in
(deg) Angle of psi(i) axis to hinge axis
(deg) Angle of psi(i) axis to hinge axis
(deg) Percentage Progress
VAL-173
LEU-174
10.1
10.4
2.8
8.3
32.6
32.7
17.2
LEU-174
GLU-175
10.3
10.5
-8.7
20.4
105.8
108.7
99.0
GLU-175
VAL-176
10.2
10.5
-4.7
6.3
163.8
160.3
13.5

Graph shows rotational transition at bending residues and can be used
to identify hinge bending residues.
Probably only informative for interdomain rotations greater than 20 degrees
Residue
iResidue
i+1Distance of hinge axis to residue i in
(A) Distance of hinge axis to residue i in
(A) Change in
(deg) Change in
(deg) Angle of psi(i) axis to hinge axis
(deg) Angle of psi(i) axis to hinge axis
(deg) Percentage Progress
PRO-185
LYS-186
7.0
7.1
-3.4
-1.8
83.3
85.0
4.5
LYS-186
VAL-187
10.7
10.8
10.2
3.8
47.0
38.8
97.2
VAL-187
ASP-188
10.6
10.4
-1.6
-9.5
101.5
96.1
-51.6

Graph shows rotational transition at bending residues and can be used
to identify hinge bending residues.
Probably only informative for interdomain rotations greater than 20 degrees
Residue
iResidue
i+1Distance of hinge axis to residue i in
(A) Distance of hinge axis to residue i in
(A) Change in
(deg) Change in
(deg) Angle of psi(i) axis to hinge axis
(deg) Angle of psi(i) axis to hinge axis
(deg) Percentage Progress
SER-189
ALA-190
6.4
6.5
1.9
-1.2
124.6
120.1
-41.3
ALA-190
VAL-191
6.5
6.4
-7.6
17.5
66.6
70.6
-36.7
VAL-191
VAL-192
5.4
5.8
-10.0
-1.2
17.7
15.4
51.3

Graph shows rotational transition at bending residues and can be used
to identify hinge bending residues.
Probably only informative for interdomain rotations greater than 20 degrees
Residue
iResidue
i+1Distance of hinge axis to residue i in
(A) Distance of hinge axis to residue i in
(A) Change in
(deg) Change in
(deg) Angle of psi(i) axis to hinge axis
(deg) Angle of psi(i) axis to hinge axis
(deg) Percentage Progress
MET-200
PRO-201
4.3
3.3
14.2
3.9
54.1
60.2
120.5
PRO-201
HIS-202
5.1
4.8
0.1
7.9
53.4
48.2
71.6
HIS-202
PRO-203
2.7
3.0
3.4
6.0
89.9
84.2
-10.8
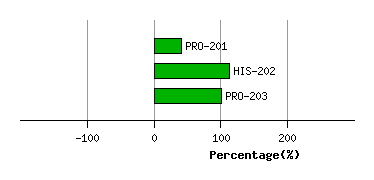
Graph shows rotational transition at bending residues and can be used
to identify hinge bending residues.
Probably only informative for interdomain rotations greater than 20 degrees