Hypothetical Oxidoreductase Yiak
(All numbering and residues are taken from first PDB file)
![]()
![]()
Bending Residue Dihedral Analysis
Residue
iResidue
i+1Distance of hinge axis to residue i in
(A) Distance of hinge axis to residue i in
(A) Change in
(deg) Change in
(deg) Angle of psi(i) axis to hinge axis
(deg) Angle of psi(i) axis to hinge axis
(deg) Percentage Progress
PHE-178
SER-179
6.1
6.7
-28.0
20.5
25.0
21.7
48.6

Graph shows rotational transition at bending residues and can be used
to identify hinge bending residues.
Probably only informative for interdomain rotations greater than 20 degrees
Residue
iResidue
i+1Distance of hinge axis to residue i in
(A) Distance of hinge axis to residue i in
(A) Change in
(deg) Change in
(deg) Angle of psi(i) axis to hinge axis
(deg) Angle of psi(i) axis to hinge axis
(deg) Percentage Progress
LEU-193
PRO-194
10.8
11.2
1.6
-7.4
148.0
144.5
40.6
PRO-194
VAL-195
8.8
8.9
3.3
2.0
84.3
80.5
23.1
VAL-195
ASP-196
7.0
6.9
11.7
-5.2
15.7
22.0
51.0
ASP-196
GLY-197
7.8
7.5
-10.8
36.4
51.0
45.1
-119.6
ASP-196
GLY-197
7.8
7.5
-10.8
36.4
51.0
45.1
-119.6

Graph shows rotational transition at bending residues and can be used
to identify hinge bending residues.
Probably only informative for interdomain rotations greater than 20 degrees
Residue
iResidue
i+1Distance of hinge axis to residue i in
(A) Distance of hinge axis to residue i in
(A) Change in
(deg) Change in
(deg) Angle of psi(i) axis to hinge axis
(deg) Angle of psi(i) axis to hinge axis
(deg) Percentage Progress
ASP-196
GLY-197
7.8
7.5
-10.8
36.4
51.0
45.1
-119.6
ASP-196
GLY-197
7.8
7.5
-10.8
36.4
51.0
45.1
-119.6
GLY-197
GLY-198
6.7
7.5
-26.6
-15.1
18.3
26.7
275.6
GLY-198
PHE-199
8.2
7.9
-0.3
20.7
88.8
84.3
-11.6

Graph shows rotational transition at bending residues and can be used
to identify hinge bending residues.
Probably only informative for interdomain rotations greater than 20 degrees
Residue
iResidue
i+1Distance of hinge axis to residue i in
(A) Distance of hinge axis to residue i in
(A) Change in
(deg) Change in
(deg) Angle of psi(i) axis to hinge axis
(deg) Angle of psi(i) axis to hinge axis
(deg) Percentage Progress
GLY-203
ASN-204
14.6
16.4
-173.4
2.1
9.1
60.2
1014.0
ASN-204
LEU-205
14.6
14.4
60.5
-9.0
110.8
107.3
-109.7
LEU-205
THR-206
11.6
11.5
18.5
-14.3
110.7
108.1
-35.8
THR-206
LYS-207
12.3
12.5
0.3
-6.4
111.6
111.2
0.1

Graph shows rotational transition at bending residues and can be used
to identify hinge bending residues.
Probably only informative for interdomain rotations greater than 20 degrees
Residue
iResidue
i+1Distance of hinge axis to residue i in
(A) Distance of hinge axis to residue i in
(A) Change in
(deg) Change in
(deg) Angle of psi(i) axis to hinge axis
(deg) Angle of psi(i) axis to hinge axis
(deg) Percentage Progress
ARG-217
ILE-218
8.0
8.1
-11.8
8.5
27.4
31.0
26.2
ILE-218
LEU-219
5.9
6.0
-3.1
-1.7
70.0
72.0
33.3
LEU-219
PRO-220
4.3
4.3
-1.9
2.7
85.4
83.7
21.4
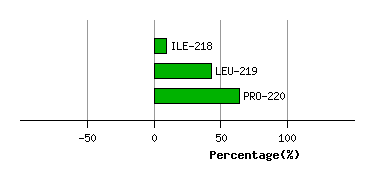
Graph shows rotational transition at bending residues and can be used
to identify hinge bending residues.
Probably only informative for interdomain rotations greater than 20 degrees