Thymidylate Synthase
(All numbering and residues are taken from first PDB file)
![]()
![]()
Bending Residue Dihedral Analysis
Residue
iResidue
i+1Distance of hinge axis to residue i in
(A) Distance of hinge axis to residue i in
(A) Change in
(deg) Change in
(deg) Angle of psi(i) axis to hinge axis
(deg) Angle of psi(i) axis to hinge axis
(deg) Percentage Progress
GLU-80
GLU-81
3.6
3.6
0.5
-0.8
169.2
171.1
92.3
GLU-81
LEU-82
4.9
4.8
-2.8
0.0
60.3
63.3
-19.3
LEU-82
LEU-83
2.8
2.8
2.8
-5.7
82.7
80.7
20.5

Graph shows rotational transition at bending residues and can be used
to identify hinge bending residues.
Probably only informative for interdomain rotations greater than 20 degrees
Residue
iResidue
i+1Distance of hinge axis to residue i in
(A) Distance of hinge axis to residue i in
(A) Change in
(deg) Change in
(deg) Angle of psi(i) axis to hinge axis
(deg) Angle of psi(i) axis to hinge axis
(deg) Percentage Progress
LEU-95
SER-96
8.7
8.9
-2.6
0.6
46.7
48.1
20.4
SER-96
SER-97
12.0
12.3
1.4
-1.9
152.0
155.6
-68.3
SER-97
LYS-98
11.7
11.9
-3.6
-2.2
54.6
53.4
268.8
LYS-98
GLY-99
8.4
8.7
0.9
3.9
114.3
109.4
-210.7

Graph shows rotational transition at bending residues and can be used
to identify hinge bending residues.
Probably only informative for interdomain rotations greater than 20 degrees
Residue
iResidue
i+1Distance of hinge axis to residue i in
(A) Distance of hinge axis to residue i in
(A) Change in
(deg) Change in
(deg) Angle of psi(i) axis to hinge axis
(deg) Angle of psi(i) axis to hinge axis
(deg) Percentage Progress
ARG-101
ILE-102
13.7
13.8
-0.5
2.8
31.5
28.3
-99.2
ILE-102
TRP-103
13.6
13.4
-4.1
3.1
27.2
26.8
-14.0
TRP-103
ASP-104
13.0
12.9
-7.9
12.7
88.8
89.8
30.2
ASP-104
ALA-105
15.9
15.9
-11.0
-2.2
51.8
48.5
88.1
ALA-105
ASN-106
18.6
18.7
6.7
3.3
157.4
154.2
-217.3
ASN-106
GLY-107
16.5
16.5
-11.5
5.2
80.7
80.8
268.7
GLY-107
SER-108
16.6
16.6
0.1
-9.5
73.3
74.6
-36.6

Graph shows rotational transition at bending residues and can be used
to identify hinge bending residues.
Probably only informative for interdomain rotations greater than 20 degrees
Residue
iResidue
i+1Distance of hinge axis to residue i in
(A) Distance of hinge axis to residue i in
(A) Change in
(deg) Change in
(deg) Angle of psi(i) axis to hinge axis
(deg) Angle of psi(i) axis to hinge axis
(deg) Percentage Progress
GLY-151
VAL-152
9.1
9.2
-5.1
7.1
69.6
68.4
-50.8
VAL-152
ASP-153
8.3
8.3
0.0
-1.9
21.1
18.8
161.3
ASP-153
GLN-154
8.5
8.5
4.0
-5.9
87.4
89.1
35.0

Graph shows rotational transition at bending residues and can be used
to identify hinge bending residues.
Probably only informative for interdomain rotations greater than 20 degrees
Residue
iResidue
i+1Distance of hinge axis to residue i in
(A) Distance of hinge axis to residue i in
(A) Change in
(deg) Change in
(deg) Angle of psi(i) axis to hinge axis
(deg) Angle of psi(i) axis to hinge axis
(deg) Percentage Progress
ASN-177
PRO-178
3.4
3.4
-2.2
2.9
52.7
53.1
84.0
PRO-178
LYS-179
5.6
5.8
-6.9
10.7
78.5
78.3
-202.6
LYS-179
ASP-180
5.9
6.0
-2.0
-0.2
136.0
139.0
159.9
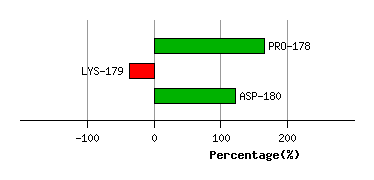
Graph shows rotational transition at bending residues and can be used
to identify hinge bending residues.
Probably only informative for interdomain rotations greater than 20 degrees
Residue
iResidue
i+1Distance of hinge axis to residue i in
(A) Distance of hinge axis to residue i in
(A) Change in
(deg) Change in
(deg) Angle of psi(i) axis to hinge axis
(deg) Angle of psi(i) axis to hinge axis
(deg) Percentage Progress
ALA-185
LEU-186
14.0
13.9
-4.7
0.2
95.4
97.5
85.0
LEU-186
PRO-187
12.9
13.2
4.2
-5.4
63.1
58.9
76.2
PRO-187
PRO-188
10.7
11.2
-1.1
-3.4
46.0
47.5
189.7
PRO-188
CYS-189
9.0
9.2
-3.0
0.8
96.6
93.0
-135.6

Graph shows rotational transition at bending residues and can be used
to identify hinge bending residues.
Probably only informative for interdomain rotations greater than 20 degrees
Residue
iResidue
i+1Distance of hinge axis to residue i in
(A) Distance of hinge axis to residue i in
(A) Change in
(deg) Change in
(deg) Angle of psi(i) axis to hinge axis
(deg) Angle of psi(i) axis to hinge axis
(deg) Percentage Progress
THR-281
ILE-282
13.1
13.2
7.7
-10.5
83.5
86.0
-28.8
ILE-282
ASP-283
9.5
9.6
8.8
-1.6
68.8
71.9
92.9
ASP-283
ASP-284
8.8
9.0
-11.8
7.6
171.1
175.7
-104.6
ASP-284
PHE-285
10.0
10.0
-0.3
1.2
126.7
125.9
101.0
PHE-285
LYS-286
7.2
7.2
2.4
-0.8
67.2
70.2
-50.8

Graph shows rotational transition at bending residues and can be used
to identify hinge bending residues.
Probably only informative for interdomain rotations greater than 20 degrees